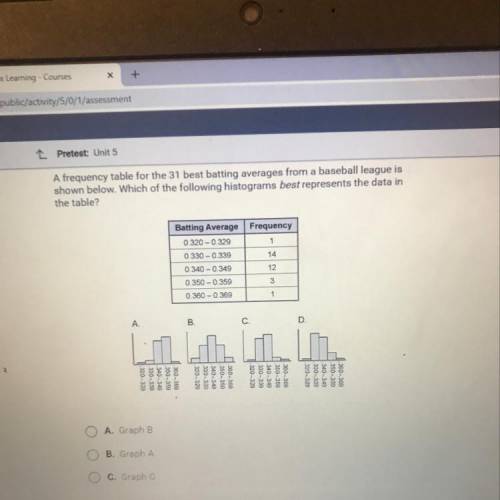
A frequency table for the 31 best batting averages from a baseball league is
shown below. Whic...

Mathematics, 25.02.2020 04:09 jdiel14
A frequency table for the 31 best batting averages from a baseball league is
shown below. Which of the following histograms best represents the data in
the table?
Batting Average
0.320 -0.329
0.330 -0.339
0.340 -0.349
0.350 -0.359
0.360 -0.369
0.360-360
350-350
.340-349
1.330-339
1.320-329
B.
1.360-369
350-359
.340-349
.330-339
1.320-329

Answers: 1


Another question on Mathematics
Mathematics, 21.06.2019 15:30
Maria donates a fixed amount, a, to a charity each month. if she donates $300 in 12 months, what is the equation for a? a. a + 300 = 12 b. a × 300 = 12 c. a × 12 = 300 d. a + 12 = 300 e. a + 32 = 100
Answers: 3
Mathematics, 21.06.2019 16:40
What is the distance between the points (2 -3) and (-6 4) on the coordinate plane
Answers: 1
Mathematics, 21.06.2019 23:00
In trapezoid abcd, ac is a diagonal and ∠abc≅∠acd. find ac if the lengths of the bases bc and ad are 12m and 27m respectively.
Answers: 3
Mathematics, 21.06.2019 23:30
Which of the following statements would be sufficient to prove that parallelograms pqrs is a rectangle ?
Answers: 2
You know the right answer?
Questions

Mathematics, 17.05.2021 16:30
Mathematics, 17.05.2021 16:30

Mathematics, 17.05.2021 16:30
Mathematics, 17.05.2021 16:30
Mathematics, 17.05.2021 16:30
Mathematics, 17.05.2021 16:30
Mathematics, 17.05.2021 16:30
History, 17.05.2021 16:30

Mathematics, 17.05.2021 16:30
English, 17.05.2021 16:30


