
Mathematics, 25.02.2020 05:25 kfloyd6046
Rothamsted Experimental Station (England) has studied wheat production since 1852. Each year many small plots of equal size but different soil/fertilizer conditions are planted with wheat. At the end of the growing season, the yield (in pounds) of the wheat on the plot is measured.
(a) Suppose for a random sample of years, one plot gave the following annual wheat production (in pounds):
4.46, 4.21, 4.40, 4.81, 2.81, 2.90, 4.93, 3.54, 4.16, 4.48, 3.26, 4.74, 4.97, 4.02, 4.91, 2.59
For this plot, the sample variance is ___.
(b) Another random sample of years for a second plot gave the following annual wheat production (in pounds):
3.89, 3.81, 3.95, 4.07, 4.01, 3.73, 4.02, 3.78, 3.72, 3.96, 3.62, 3.76, 4.02, 3.73, 3.94, 4.03
For this plot, the sample variance is ___.
(c) Test the claim using that the population variance of annual wheat production for the first plot is larger than that for the second plot.

Answers: 3
 = Sum of all values ÷ n (no. of values)
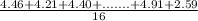 = 4.074
 =
=  =
=  = 0.653
 = Sum of all values ÷ n (no. of values)
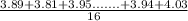 = 3.88
 =
=  =
=  = 0.0198
  :
:  or
or 
 or
or 
 ~
~  where,
  and
and 
 ~
~ 


Another question on Mathematics
Mathematics, 22.06.2019 03:30
The slope of the line passing through the points (2, 7) and (-4, 8) is
Answers: 2
You know the right answer?
Rothamsted Experimental Station (England) has studied wheat production since 1852. Each year many sm...
Questions
Mathematics, 09.02.2021 06:20
Mathematics, 09.02.2021 06:20
Mathematics, 09.02.2021 06:20


Mathematics, 09.02.2021 06:20


Chemistry, 09.02.2021 06:20


Health, 09.02.2021 06:20
Mathematics, 09.02.2021 06:20
Mathematics, 09.02.2021 06:20

History, 09.02.2021 06:20


