
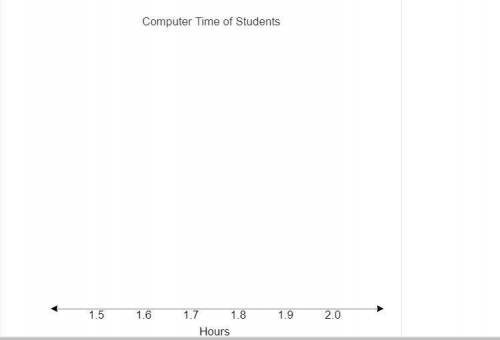
The table shows the average number of hours different students spend on the computer each day.
...

Mathematics, 25.02.2020 22:51 haitiindianari
The table shows the average number of hours different students spend on the computer each day.
Average Time (hours)
1.6 2.0 1.5 1.6 1.6 1.8
2.0 1.8 2.0 1.9 1.6 1.5
2.0 1.8 1.9 1.7 2.0 2.0
Create a line plot to display the data. To create a line plot, hover over each number on the number line. Then click and drag up to plot the data.

Answers: 1


Another question on Mathematics
Mathematics, 21.06.2019 18:40
This stem-and-leaf plot represents the heights of the students on ralph's basketball team. one student's height is missing from the plot. if the mean height of all the students on the team is 61 inches, what is the missing height? a. 55 in. b. 59 in. c. 61 in. d. 65 in.
Answers: 2
Mathematics, 21.06.2019 20:50
Including 6% sales tax, an inn charges $135.68 per night. find the inns nightly cost
Answers: 1
Mathematics, 21.06.2019 22:00
Write an inequality for this description. - one fourth of the opposite of the difference of five and a number is less than twenty.
Answers: 1
You know the right answer?
Questions


History, 03.08.2019 12:00

Biology, 03.08.2019 12:00
Biology, 03.08.2019 12:00


Social Studies, 03.08.2019 12:00
Mathematics, 03.08.2019 12:00
History, 03.08.2019 12:00

Biology, 03.08.2019 12:00
History, 03.08.2019 12:00
History, 03.08.2019 12:00
History, 03.08.2019 12:00
Mathematics, 03.08.2019 12:00


