Use the drawing tool(s) to form the correct answer on the provided grid.
Function fis shown on...

Mathematics, 26.02.2020 16:00 mads3499
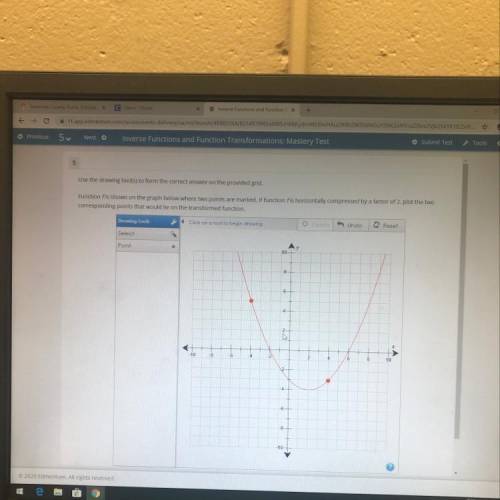
Use the drawing tool(s) to form the correct answer on the provided grid.
Function fis shown on the graph below where two points are marked. If function fis horizontally compressed by a factor of 2. plot the two
corresponding points that would lie on the transformed function.
Drawing Tools
click on a tool to begin drawing
Undo Reset
Select
Point

Answers: 3


Another question on Mathematics
Mathematics, 21.06.2019 13:30
Which equation represents a proportional relationship that has a constant of proportionality equal to 1/5
Answers: 1
Mathematics, 21.06.2019 19:30
Now max recorded the heights of 500 male humans. he found that the heights were normally distributed around a mean of 177 centimeters. which statements about max’s data must be true? a) the median of max’s data is 250 b) more than half of the data points max recorded were 177 centimeters. c) a data point chosen at random is as likely to be above the mean as it is to be below the mean. d) every height within three standard deviations of the mean is equally likely to be chosen if a data point is selected at random.
Answers: 1
Mathematics, 21.06.2019 20:00
Prove that the value of the expression 7^8–7^7+7^6 is divisible by 43.
Answers: 1
You know the right answer?
Questions


Biology, 22.01.2020 04:31


Mathematics, 22.01.2020 04:31

Mathematics, 22.01.2020 04:31
Mathematics, 22.01.2020 04:31
English, 22.01.2020 04:31
Biology, 22.01.2020 04:31


