
Mathematics, 28.02.2020 03:43 BeautyxQueen
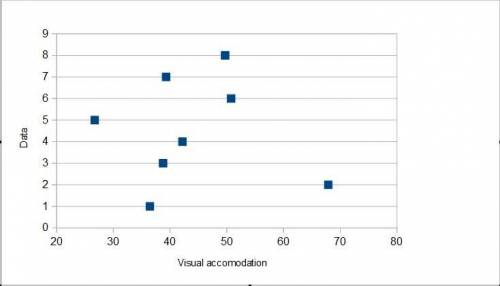
An article in Human Factors (June 1989) presented data on visual accommodation (a function of eye movement) when recognizing a .speckle pattern on a high-resolution CRT screen. The data are as follows: 36.45, 67.90. 38.77. 42.18, 26.72, 50.77, 39.30, and 49.71. Calculate the sample average and sample standard deviation. Construct a dot diagram of the data.

Answers: 2
![\frac{1}{n-1}*[sumX^2-\frac{(sumX)^2}{n} ]](/tpl/images/0527/6579/26a1a.png)
![\frac{1}{7}*[16528.40-\frac{(351.80)^2}{8} ]](/tpl/images/0527/6579/8d5d4.png)


Another question on Mathematics
Mathematics, 21.06.2019 20:30
Kayla made observations about the sellin price of a new brand of coffee that sold in the three different sized bags she recorded those observations in the following table 6 is $2.10 8 is $2.80 and 16 is to $5.60 use the relationship to predict the cost of a 20oz bag of coffee.
Answers: 3
Mathematics, 21.06.2019 20:40
Reduce fractions expressing probability to lowest terms. in 3,000 repetitions of an experiment, a random event occurred in 500 cases. the expected probability of this event is?
Answers: 3
You know the right answer?
An article in Human Factors (June 1989) presented data on visual accommodation (a function of eye mo...
Questions


History, 06.04.2021 16:30


Mathematics, 06.04.2021 16:30
Chemistry, 06.04.2021 16:30
History, 06.04.2021 16:30
Mathematics, 06.04.2021 16:30
English, 06.04.2021 16:30
Mathematics, 06.04.2021 16:30

Geography, 06.04.2021 16:30
SAT, 06.04.2021 16:30

Computers and Technology, 06.04.2021 16:30


