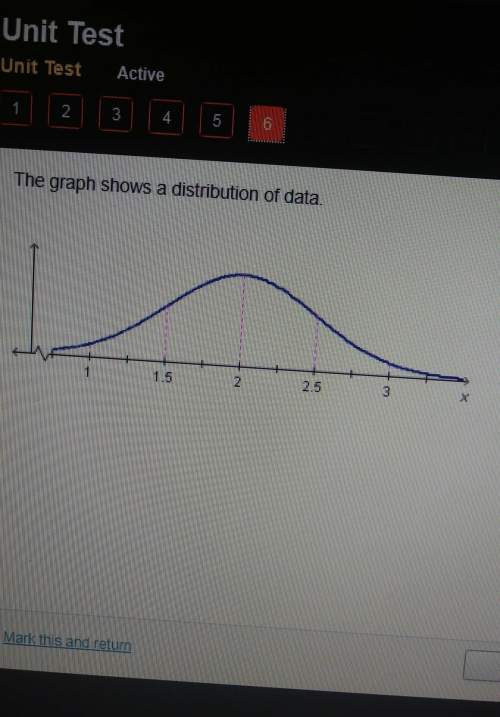
The following dot plot represents Set A.
How many data points are in Set A?
Calcul...

Mathematics, 28.02.2020 08:47 loyaltyandgood
The following dot plot represents Set A.
How many data points are in Set A?
Calculate the median and mode for this set of data.
Calculate the range and interquartile range for this set of data.
Visually analyze the data, using the terms cluster, gap, and outlier in your analysis. Write your answer in two or more complete sentences.


Answers: 3


Another question on Mathematics

Mathematics, 21.06.2019 14:50
What is f(3) for the quadratic functionf(x)=2x2 + x – 12? f -3g 3h 6i. 9
Answers: 1

Mathematics, 21.06.2019 15:00
With these: 18/36 = 1/? missing number change 1 5/8 to improper fraction. change 19/5 to a mixed number.
Answers: 1

Mathematics, 21.06.2019 22:00
Consider the triangle. which shows the order of the angles from smallest to largest? angle a, angle b, angle c angle b, angle a, angle c angle b, angle c, angle a angle c, angle a, angle b
Answers: 3

Mathematics, 22.06.2019 00:30
Jennifer taking a quiz and has answered 13 questions so far. if there are 25 questions on jennifer test, how many questions does she have left to answer
Answers: 1
You know the right answer?
Questions


