Use the graph shown to determine the TRUE statements.
The x-intercept tells the number...

Mathematics, 28.02.2020 20:51 jarviantemelton
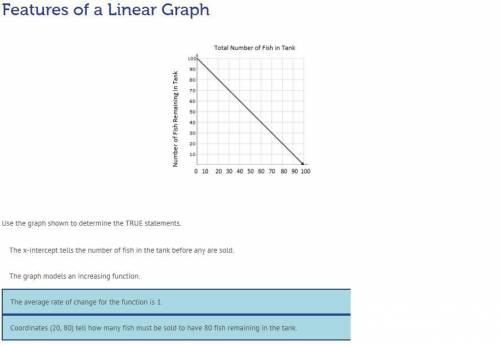
Use the graph shown to determine the TRUE statements.
The x-intercept tells the number of fish in the tank before any are sold.
The graph models an increasing function.
The average rate of change for the function is 1.
Coordinates (20, 80) tell how many fish must be sold to have 80 fish remaining in the tank.

Answers: 3


Another question on Mathematics
Mathematics, 21.06.2019 19:00
What is the expression in factored form? 3x^2 + 18x + 24 a. 3(x+2)(x+4) b. 3(x-2)(x+4) c. 3(x-2)(x-4) d. 3(x+2)(x-4)
Answers: 2
Mathematics, 21.06.2019 20:30
Find the value of x. give reasons to justify your solutions! h ∈ ig
Answers: 1
Mathematics, 21.06.2019 22:00
Alex took his brother to a birthday party. the party was scheduled to last for 1 and 3/4 hours but they stayed for 4/5 of an hour more. how long did she stay at the party?
Answers: 2
You know the right answer?
Questions

History, 20.01.2021 19:50

English, 20.01.2021 19:50


Biology, 20.01.2021 19:50

Health, 20.01.2021 19:50
Mathematics, 20.01.2021 19:50

Arts, 20.01.2021 19:50
Mathematics, 20.01.2021 19:50
History, 20.01.2021 19:50
English, 20.01.2021 19:50

World Languages, 20.01.2021 19:50
Mathematics, 20.01.2021 19:50
Mathematics, 20.01.2021 19:50

Computers and Technology, 20.01.2021 19:50


