Describe the trend in the scatter plot.
-no correlation
-negative correlatio...

Mathematics, 29.02.2020 09:20 Uschi
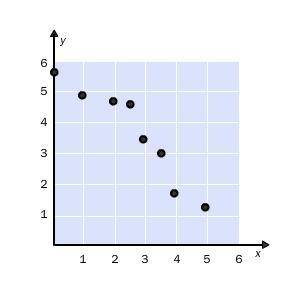
Describe the trend in the scatter plot.
-no correlation
-negative correlation
-positive correlation
-not enough information because the trend line is unclear

Answers: 1


Another question on Mathematics
Mathematics, 21.06.2019 19:40
Ascatter plot with a trend line is shown below. which equation best represents the given data? y = x + 2 y = x + 5 y = 2x + 5
Answers: 1
Mathematics, 21.06.2019 20:00
M the table below represents a linear function f(x) and the equation represents a function g(x): x f(x)−1 −50 −11 3g(x)g(x) = 2x − 7part a: write a sentence to compare the slope of the two functions and show the steps you used to determine the slope of f(x) and g(x). (6 points)part b: which function has a greater y-intercept? justify your answer. (4 points)
Answers: 3
Mathematics, 21.06.2019 21:30
On #16 : explain how factoring a trinomial, ax^2+ bx+ c, when a does not equal 1 different from factoring a trinomial when a = 1.
Answers: 2
You know the right answer?
Questions
Mathematics, 06.05.2020 08:36

English, 06.05.2020 08:36

Mathematics, 06.05.2020 08:36
English, 06.05.2020 08:36


Mathematics, 06.05.2020 08:36
English, 06.05.2020 08:36


