
Mathematics, 03.03.2020 22:35 jennyhoang4330
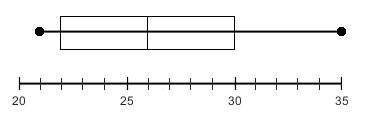
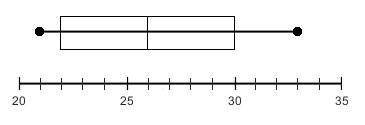
Clarissa made the box and whisker plot on the left below. When she finished and looked back at the data set, she realized that she had forgotten to include one entry, 35, in her plot. Since 35 is the highest number in the set, Clarissa simply extended the right whisker to make the box and whisker plot on the right. Can Clarissa be sure that her new graph is now correct? Why or why not?

Answers: 1


Another question on Mathematics
Mathematics, 21.06.2019 16:00
Part one: measurements 1. measure your own height and arm span (from finger-tip to finger-tip) in inches. you will likely need some from a parent, guardian, or sibling to get accurate measurements. record your measurements on the "data record" document. use the "data record" to you complete part two of this project. name relationship to student x height in inches y arm span in inches archie dad 72 72 ginelle mom 65 66 sarah sister 64 65 meleah sister 66 3/4 67 rachel sister 53 1/2 53 emily auntie 66 1/2 66 hannah myself 66 1/2 69 part two: representation of data with plots 1. using graphing software of your choice, create a scatter plot of your data. predict the line of best fit, and sketch it on your graph. part three: the line of best fit include your scatter plot and the answers to the following questions in your word processing document 1. 1. which variable did you plot on the x-axis, and which variable did you plot on the y-axis? explain why you assigned the variables in that way. 2. write the equation of the line of best fit using the slope-intercept formula $y = mx + b$. show all your work, including the points used to determine the slope and how the equation was determined. 3. what does the slope of the line represent within the context of your graph? what does the y-intercept represent? 5. use the line of best fit to you to describe the data correlation.
Answers: 2
Mathematics, 21.06.2019 22:30
Proving the parallelogram diagonal theoremgiven abcd is a parralelogam, diagnals ac and bd intersect at eprove ae is conruent to ce and be is congruent to de
Answers: 1
Mathematics, 22.06.2019 02:00
Aculinary club earns $1360 from a dinner service. they sold 45 adult meals and 80 student meals. an adult meal costs twice as much as a student meal. what is the cost of an adult meal?
Answers: 1
You know the right answer?
Clarissa made the box and whisker plot on the left below. When she finished and looked back at the d...
Questions


History, 10.09.2019 16:20


Biology, 10.09.2019 16:20


