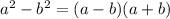


Replace ∗ with a monomial so that the result is an identity:
1. (2a + ∗)(2a - ∗) = 4a^2...

Mathematics, 05.03.2020 08:16 sierravick123owr441
Replace ∗ with a monomial so that the result is an identity:
1. (2a + ∗)(2a - ∗) = 4a^2–b^2
2. (∗− 3x )(∗ +3x) = 16y^2–9x^2
3. 100m^4–4n^6 = (10m^2−∗)(∗ +10m^2)
4. m^4–225c^10 = (m^2−∗)(∗ +m^2).

Answers: 3


Another question on Mathematics
Mathematics, 21.06.2019 14:00
Colin listed his assets and liabilities on a personal balance sheet. colin’s balance sheet (august 2013) assets liabilities cash $1,500 credit card $500 stocks $800 rent $800 car $5,000 car loan $1,200 coin collection $1,200 student loan $5,000 total total which statement is true about the total assets and the total liabilities? the total of the assets and the liabilities are the same. the total of the assets is greater than the total of the liabilities. the total of the assets is less than the total of the liabilities. the total of the assets cannot be compared to the total of the liabilities.
Answers: 2
Mathematics, 21.06.2019 16:00
Part one: measurements 1. measure your own height and arm span (from finger-tip to finger-tip) in inches. you will likely need some from a parent, guardian, or sibling to get accurate measurements. record your measurements on the "data record" document. use the "data record" to you complete part two of this project. name relationship to student x height in inches y arm span in inches archie dad 72 72 ginelle mom 65 66 sarah sister 64 65 meleah sister 66 3/4 67 rachel sister 53 1/2 53 emily auntie 66 1/2 66 hannah myself 66 1/2 69 part two: representation of data with plots 1. using graphing software of your choice, create a scatter plot of your data. predict the line of best fit, and sketch it on your graph. part three: the line of best fit include your scatter plot and the answers to the following questions in your word processing document 1. 1. which variable did you plot on the x-axis, and which variable did you plot on the y-axis? explain why you assigned the variables in that way. 2. write the equation of the line of best fit using the slope-intercept formula $y = mx + b$. show all your work, including the points used to determine the slope and how the equation was determined. 3. what does the slope of the line represent within the context of your graph? what does the y-intercept represent? 5. use the line of best fit to you to describe the data correlation.
Answers: 2
Mathematics, 21.06.2019 18:00
Adriveway is 40 yards long about how many meters long is it
Answers: 2
You know the right answer?
Questions

Biology, 13.09.2020 14:01
Mathematics, 13.09.2020 14:01
Mathematics, 13.09.2020 14:01
Mathematics, 13.09.2020 14:01
Mathematics, 13.09.2020 14:01
Mathematics, 13.09.2020 14:01
Mathematics, 13.09.2020 14:01

English, 13.09.2020 14:01
Mathematics, 13.09.2020 14:01

History, 13.09.2020 14:01
History, 13.09.2020 14:01
English, 13.09.2020 14:01
English, 13.09.2020 14:01
Mathematics, 13.09.2020 14:01
Mathematics, 13.09.2020 14:01
Mathematics, 13.09.2020 14:01
Mathematics, 13.09.2020 14:01
Mathematics, 13.09.2020 14:01

Chemistry, 13.09.2020 14:01
Mathematics, 13.09.2020 14:01


