
Mathematics, 06.03.2020 02:47 samanthasheets8362
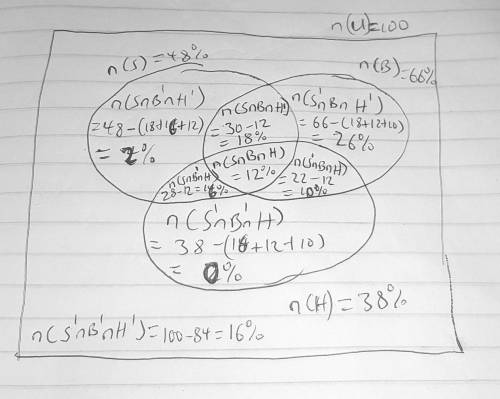
A sports survey taken at THS shows that 48% of the respondents liked soccer, 66% liked basketball and 38% liked hockey. Also,30% liked soccer and basketball, 22% liked basketball and hockey, 28% liked soccer and hockey. finally, 12% liked all three sports. A. Draw a. venn diagram to represent the given information. B. What is the probability that a randomly selected student likes basketball or hockey? Solve this by also using an appropriate formula. C. What is the probability that a randomly selected student does not like any of these sports?

Answers: 2


Another question on Mathematics
Mathematics, 21.06.2019 14:50
50 ! pls ! 12. building codes regulate the steepness of stairs. homes must have steps that are at least 13 inches wide for each 8 inches that they rise.
a. discuss how to find the slope of the stairs.
b. describe how changing the width or height affects the steepness of the stairs.
Answers: 2
Mathematics, 21.06.2019 16:30
The perimeter of a triangle is 69 cm. the first is 5 cm shorter than the second side. the third side is twice as long the first side. find the length of each side
Answers: 1
Mathematics, 21.06.2019 17:40
Which number produces a rationale number when multiplied by 1/5
Answers: 1
Mathematics, 21.06.2019 19:30
At 6 1/2 cents per pound of string beans how much does 7 pounds cost
Answers: 1
You know the right answer?
A sports survey taken at THS shows that 48% of the respondents liked soccer, 66% liked basketball an...
Questions

Computers and Technology, 03.12.2021 19:40

Computers and Technology, 03.12.2021 19:40

English, 03.12.2021 19:40


Social Studies, 03.12.2021 19:40
Engineering, 03.12.2021 19:40


Spanish, 03.12.2021 19:40

Business, 03.12.2021 19:40
Mathematics, 03.12.2021 19:40


