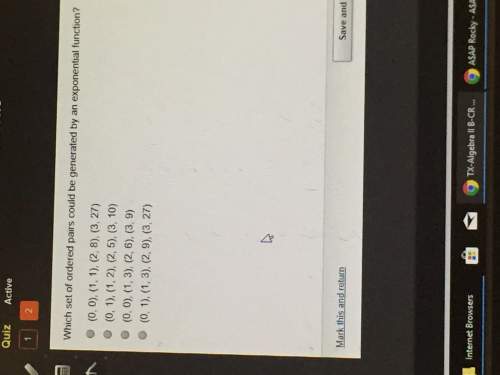
Question 2
Part A
Let's work with some actual data this time. Go online to research and...

Mathematics, 06.03.2020 10:38 mikiahpowell92
Question 2
Part A
Let's work with some actual data this time. Go online to research and find a set of real-world data in two
variables. The data can be in tabular form or in a scatter plot. Choose data that has a reasonable number
of data points so you're able to uncover trends. For the purposes of this activity, the data must not show a
linear association. Describe the data you've identified in a sentence or two, and include a link to the data.

Answers: 3


Another question on Mathematics

Mathematics, 22.06.2019 02:30
Find the area of the region between a regular hexagon with sides of 6" and its inscribed circle.
Answers: 1

Mathematics, 22.06.2019 02:40
If /is a line of symmetry, plot the partner points for the ones shown. noch 6 5 4 -3 -2 -1
Answers: 1

Mathematics, 22.06.2019 03:40
The following numbers will result in a quotient that is less than 1 when it is divided by ? a.2% e. 1 and 2/3 b.x2 f. 1/5 c. 3/10 g. 7/15 d. 5/9
Answers: 1

Mathematics, 22.06.2019 04:00
The given dot plot represents the average daily temperatures, in degrees fahrenheit, recorded in a town during the first 15 days of september. if the dot plot is converted to a box plot, the first quartile would be drawn at , ( 59,60,61,62) and the third quartile would be drawn at . (61,62,63,64)
Answers: 2
You know the right answer?
Questions

Mathematics, 19.10.2020 23:01

Biology, 19.10.2020 23:01


English, 19.10.2020 23:01


Business, 19.10.2020 23:01

Mathematics, 19.10.2020 23:01

Mathematics, 19.10.2020 23:01


English, 19.10.2020 23:01


