
Mathematics, 09.03.2020 01:33 Mamiwork2
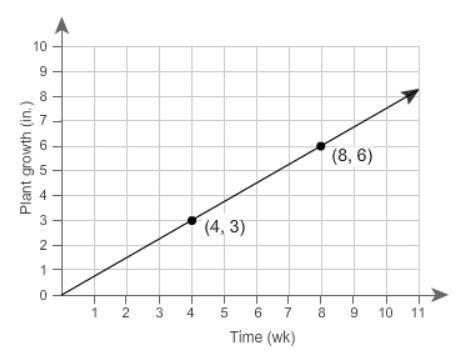
Relationship B has a greater rate than Relationship A. This graph represents Relationship A.
What table could represent Relationship B?
Time (weeks)
2 5 6 9
Plant growth (in.)
1.2 3 3.6 5.4
Time (weeks)
2 5 6 9
Plant growth (in.)
1.6 4 4.8 7.2
Time (weeks)
3 4 6 9
Plant growth (in.)
1.5 2 3 4.5
Time (weeks)
2 5 6 9
Plant growth (in.)
1.4 3.5 4.2 6.3

Answers: 2
 .
.


Another question on Mathematics
Mathematics, 21.06.2019 15:00
Which property is illustrated by the statement given below? raj raj.
Answers: 3
Mathematics, 21.06.2019 17:00
Need this asap if anyone can i would be very grateful. if you could show workings that would really
Answers: 1
Mathematics, 21.06.2019 18:30
The height of a flare fired from the deck of a ship in distress can be modeled by h(t)= -2(8t^2-52t-28), where h is the height of the flare above water and t is the time in seconds. a. find the time it takes the flare to hit the water.
Answers: 1
Mathematics, 21.06.2019 19:30
Jane moves from a house with 71 square feet of closet space to an apartment with 45.44 square feet of closet space. what is the percentage decrease of jane’s closet space?
Answers: 1
You know the right answer?
Relationship B has a greater rate than Relationship A. This graph represents Relationship A.
Questions


Arts, 11.10.2020 01:01

English, 11.10.2020 01:01
Mathematics, 11.10.2020 01:01
Mathematics, 11.10.2020 01:01
History, 11.10.2020 01:01

Biology, 11.10.2020 01:01

Chemistry, 11.10.2020 01:01
Mathematics, 11.10.2020 01:01
Mathematics, 11.10.2020 01:01
Mathematics, 11.10.2020 01:01


