![r=\frac{n(\sum xy)-(\sum x)(\sum y)}{\sqrt{[n\sum x^2 -(\sum x)^2][n\sum y^2 -(\sum y)^2]}}](/tpl/images/0541/2302/ec454.png)

![r=\frac{10(330.0321)-(75.81948)(43.5231)}{\sqrt{[10(574.8598) -(75.819)^2][10(192.8274) -(43.5231)^2]}}=0.989](/tpl/images/0541/2302/c7336.png)
![r=\frac{10(330.0321)-(75.81948)(43.5231)}{\sqrt{[10(574.8598) -(75.81948)^2][10(192.8274) -(43.5231)^2]}}=0.989](/tpl/images/0541/2302/07d17.png)
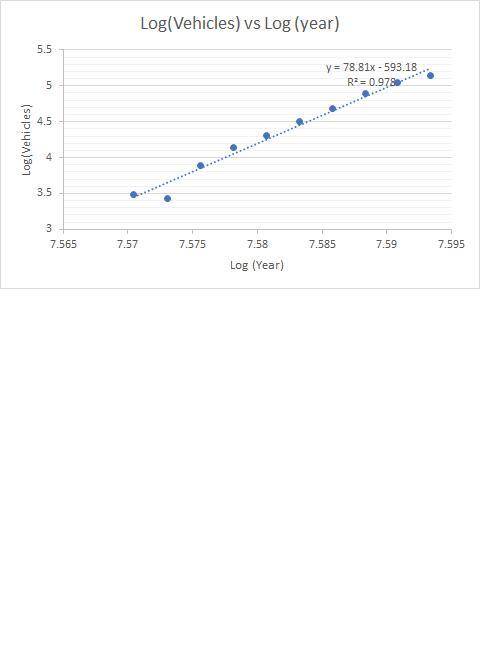
The number of motor vehicles registered in millions in the US has grown as follows:
Year...

Mathematics, 10.03.2020 18:56 tysongraham5232
The number of motor vehicles registered in millions in the US has grown as follows:
Year: 1940, 1945 1950, 1955, 1960, 1965, 1970, 1975, 1980, 1985
Vehicles: 32.4, 31.0, 49.2, 62.7, 73.9, 90.4, 108.4, 132.9, 155.8, 171.7
(Where Year = X and Vehicles = Y)
Use logarithms to transform the data into a linear association. White the equation of the LSRL. Your answer should have logs in it. Remember to define any variables.
a. Present a scatter plot for the data. (Hint: let x = 0 represent the year 1940)
b. Determine the correlation coefficient for the data and interpret the value.

Answers: 3


Another question on Mathematics
Mathematics, 20.06.2019 18:02
The average human heart beats 72 beats per minute. how many times does it beat in 15 seconds?
Answers: 1
Mathematics, 21.06.2019 16:00
Drag the tiles to the correct boxes to complete the pairs. not all tiles will be used. the heights of the girls in an advanced swimming course are 55, 60, 59, 52, 65, 66, 62, and 65 inches. match the measures of this data with their values.
Answers: 1
Mathematics, 21.06.2019 17:30
Any is very appreciated! (picture is provided below)not sure how to do this at all won't lie
Answers: 1
Mathematics, 21.06.2019 17:40
Which number produces a rationale number when multiplied by 1/5
Answers: 1
You know the right answer?
Questions

Mathematics, 09.01.2021 01:50

Social Studies, 09.01.2021 01:50
Mathematics, 09.01.2021 01:50
Mathematics, 09.01.2021 01:50

History, 09.01.2021 01:50
Mathematics, 09.01.2021 01:50

Arts, 09.01.2021 01:50

Physics, 09.01.2021 01:50
Mathematics, 09.01.2021 01:50
Physics, 09.01.2021 01:50

Mathematics, 09.01.2021 01:50
Mathematics, 09.01.2021 01:50
Social Studies, 09.01.2021 01:50


