
Mathematics, 11.03.2020 02:27 megankbrown
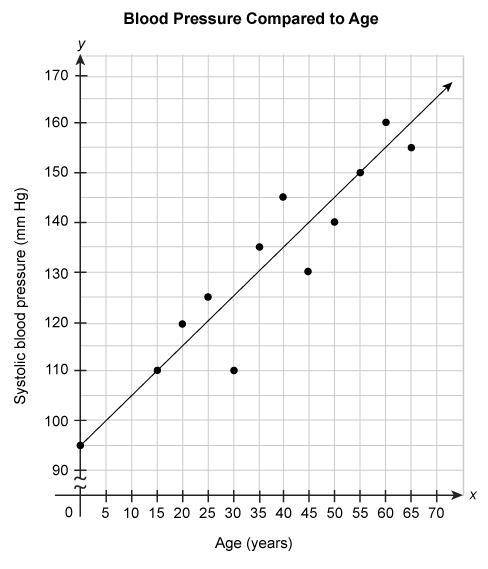
The scatter plot shows the systolic blood pressure of people of several different ages. The equation represents the linear model for this data.
y = x + 95
According to the model, what is the systolic blood pressure of someone who is 42 years old?

Answers: 3


Another question on Mathematics
Mathematics, 21.06.2019 16:00
Tamera puts 15/4 gallons of gasoline in her car. which mixed number represents the gallons of gasoline? a) 2 3/4 gallons b) 3 1/4 gallons c) 3 3/4 gallons d) 4 1/2 gallons answer it's worth a lot of points!
Answers: 3
Mathematics, 21.06.2019 20:00
How can you construct perpendicular lines and prove theorems about perpendicular lines
Answers: 3
Mathematics, 21.06.2019 20:30
Find the solution(s) to the system of equations. select all that apply y=x^2-1 y=2x-2
Answers: 2
You know the right answer?
The scatter plot shows the systolic blood pressure of people of several different ages. The equation...
Questions


Mathematics, 01.12.2021 02:20
Mathematics, 01.12.2021 02:20

Social Studies, 01.12.2021 02:20
Chemistry, 01.12.2021 02:20

Computers and Technology, 01.12.2021 02:20

Chemistry, 01.12.2021 02:20
Health, 01.12.2021 02:20
Mathematics, 01.12.2021 02:20
Mathematics, 01.12.2021 02:20
Mathematics, 01.12.2021 02:20


