
Mathematics, 11.03.2020 17:57 pandasarecute53
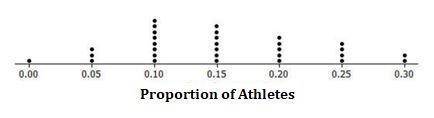
30 random samples of high school students were asked if they played a sport for their high school. Each sample was 20 students. The dot plot represents the 30 random sample proportions.
Choose all that are correct.
A sample proportion of 0.20 means that 4 of 20 high school students responded that they play a sport.
Based on the sample distribution, the best prediction for the proportion of all high school students that play a sport is 0.10.
The mean of the 30 sample proportions calculated to the nearest hundredth is 0.16.
The shape of the sample distribution is fairly symmetrical.

Answers: 2


Another question on Mathematics
Mathematics, 21.06.2019 15:00
Given the choice between receiving $1.000.000 in one month or a single penny-doubled everyday for the period of one month; which option would you choice? show your work to support your answer. (assume that 1 month=30 days)
Answers: 1
Mathematics, 21.06.2019 16:00
Question: what is the value of x 4x-2= (-7) +5x. it would be greatly appreciated if someone could actually explain to me step by step
Answers: 2
Mathematics, 21.06.2019 19:30
Solve the following inequalities and show the solution on a number line. 2x+3< 3(4x+5)
Answers: 1
You know the right answer?
30 random samples of high school students were asked if they played a sport for their high school. E...
Questions
Mathematics, 04.01.2021 14:00
Mathematics, 04.01.2021 14:00


Physics, 04.01.2021 14:00

Business, 04.01.2021 14:00

English, 04.01.2021 14:00
English, 04.01.2021 14:00

History, 04.01.2021 14:00
Mathematics, 04.01.2021 14:00
History, 04.01.2021 14:00
Biology, 04.01.2021 14:00

Social Studies, 04.01.2021 14:00
Social Studies, 04.01.2021 14:00
Mathematics, 04.01.2021 14:00


