
Mathematics, 11.03.2020 22:24 alex7881
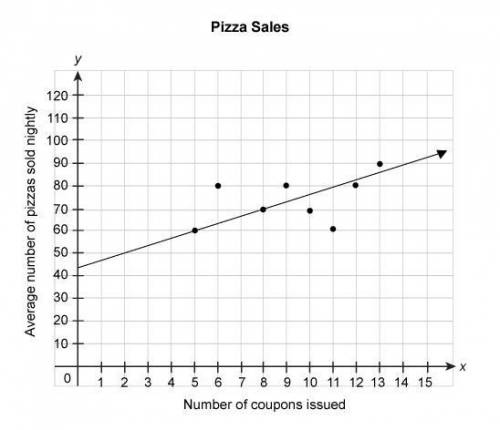
The scatter plot shows the number of pizzas sold during weeks when different numbers of coupons were issued. The equation represents the linear model for this data.
y = 3.4x + 43
What does the number 3.4 in the equation mean in this context?
There were 3.4 pizzas sold and 3.4 coupons issued every night.
The number of coupons issued in 6 days was 3.4.
There were 3.4 coupons issued each night.
There were 3.4 pizzas sold for every coupon issued.

Answers: 2


Another question on Mathematics
Mathematics, 21.06.2019 19:30
Write a function rule for the table. hours worked pay 2 $16.00 4 $32.00 6 $48.00 8 $64.00 p = 16h p = 8.00h p = h + 16 h = 8.00p
Answers: 1
Mathematics, 21.06.2019 19:30
What are the solutions to the following equation? |m| = 8.5 the value of m is equal to 8.5 and because each distance from zero is 8.5.
Answers: 3
Mathematics, 21.06.2019 20:00
Graph the linear function using the slooe and y intercept
Answers: 2
Mathematics, 21.06.2019 22:00
You're locked out of your house. the only open window is on the second floor, 25 feet above the ground. there are bushes along the edge of the house, so you will need to place the ladder 10 feet from the house. what length ladder do you need to reach the window?
Answers: 3
You know the right answer?
The scatter plot shows the number of pizzas sold during weeks when different numbers of coupons were...
Questions
Mathematics, 12.10.2020 14:01

English, 12.10.2020 14:01

Chemistry, 12.10.2020 14:01

History, 12.10.2020 14:01
History, 12.10.2020 14:01
Mathematics, 12.10.2020 14:01
Chemistry, 12.10.2020 14:01
Mathematics, 12.10.2020 14:01

Biology, 12.10.2020 14:01
Biology, 12.10.2020 14:01
History, 12.10.2020 14:01
Chemistry, 12.10.2020 14:01
History, 12.10.2020 14:01


