The graph below shows the relationship between two variables.
Which scenario is BEST rep...

Mathematics, 13.03.2020 05:01 stormserena
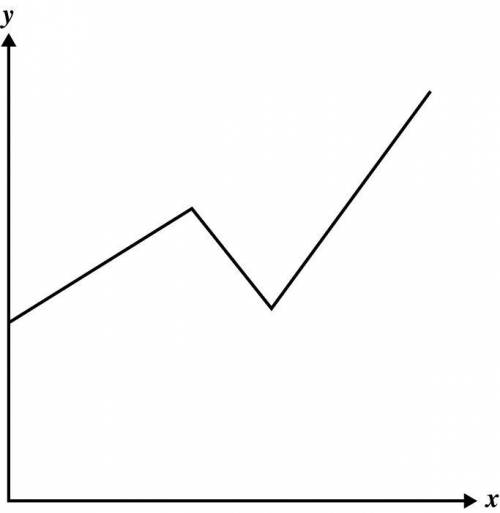
The graph below shows the relationship between two variables.
Which scenario is BEST represented by the graph?
David drove at a constant speed before slowing down in a school zone. He then increased the speed of his car.
The number of perfect test scores by students in a math class increased from the first to the second grading period and then began to decline.
After a period of slow growth, the height of a plant remained the same for 2 weeks. It was then fertilized and began to rapidly increase in height.
The number of employees at a store increased at a constant rate for 5 years. There was a decrease in the number of employees for 2 years. Then the number of employees increased at a greater constant rate for the next few years.

Answers: 1


Another question on Mathematics
Mathematics, 21.06.2019 20:30
Tom is the deli manager at a grocery store. he needs to schedule employee to staff the deli department for no more that 260 person-hours per week. tom has one part-time employee who works 20 person-hours per week. each full-time employee works 40 person-hours per week. write and inequality to determine n, the number of full-time employees tom may schedule, so that his employees work on more than 260 person-hours per week. graph the solution set to this inequality.
Answers: 2
Mathematics, 21.06.2019 23:00
In triangle △abc, ∠abc=90°, bh is an altitude. find the missing lengths. ac=26 and ch=8, find bh.
Answers: 3
Mathematics, 22.06.2019 06:00
Match the scenarios with terms related to financial aid.pell grantstudent loanmerit-based scholarshiprichard is one of the leading college basketball players in the state of florida. he also maintains a good academic record. looking at his talent and potential, furman university offers to bear the expenses for his college education.anita wants to pursue a certificate program in sports nutrition. to pay for the course, she borrows money by filing the fafsa.nathan comes from a low-income household. he wants to pursue an undergraduate degree in marketing. he receives financial aid covering 50 percent of his college expenses. nathan does not have to pay back this amount.
Answers: 2
You know the right answer?
Questions

History, 12.10.2019 17:00


German, 12.10.2019 17:00
History, 12.10.2019 17:00

Chemistry, 12.10.2019 17:00
Chemistry, 12.10.2019 17:00
Mathematics, 12.10.2019 17:00
Mathematics, 12.10.2019 17:00
Mathematics, 12.10.2019 17:00
History, 12.10.2019 17:00

Physics, 12.10.2019 17:00
Mathematics, 12.10.2019 17:00

Biology, 12.10.2019 17:00
History, 12.10.2019 17:00


