
The graph represents function 1, and the equation represents funtion 2:
function 2
...

Mathematics, 13.03.2020 15:54 mrsjenrucker
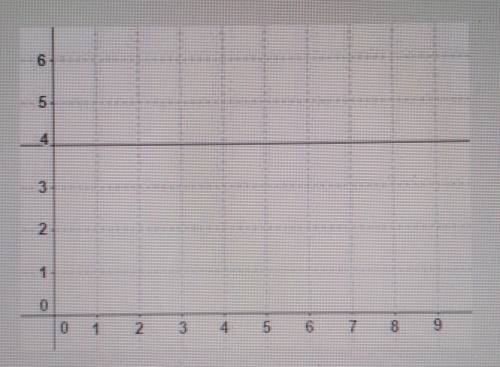
The graph represents function 1, and the equation represents funtion 2:
function 2
y = 8x + 12
how much more is the rate of change of function 2 than the rate of change of function 1?
3
4
5
8

Answers: 2


Another question on Mathematics
Mathematics, 21.06.2019 22:30
Amachine that produces a special type of transistor (a component of computers) has a 2% defective rate. the production is considered a random process where each transistor is independent of the others. (a) what is the probability that the 10th transistor produced is the first with a defect? (b) what is the probability that the machine produces no defective transistors in a batch of 100? (c) on average, how many transistors would you expect to be produced before the first with a defect? what is the standard deviation? (d) another machine that also produces transistors has a 5% defective rate where each transistor is produced independent of the others. on average how many transistors would you expect to be produced with this machine before the first with a defect? what is the standard deviation? (e) based on your answers to parts (c) and (d), how does increasing the probability of an event a↵ect the mean and standard deviation of the wait time until success?
Answers: 3
Mathematics, 21.06.2019 23:30
Hundred and tens tables to make 430 in five different ways
Answers: 1
You know the right answer?
Questions


Biology, 28.07.2019 23:00
Mathematics, 28.07.2019 23:00

Chemistry, 28.07.2019 23:00
Mathematics, 28.07.2019 23:00


History, 28.07.2019 23:00


