
Mathematics, 13.03.2020 16:24 camillanewberry
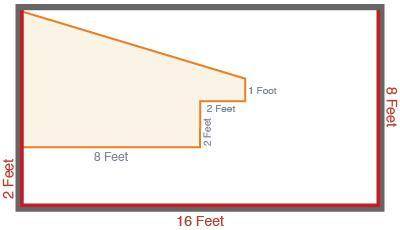
The figure below shows a shaded region and a non-shaded region. Angles in the figure that appear to be right angles are right angles. A picture of a rectangle is shown. The bottom of the rectangle is labeled 16 ft. The right side of the rectangle is labeled 8 ft. At the bottom left side of the rectangle there is a label that reads 2 ft. Inside the rectangle is a shaded region. The bottom of the region is labeled 8 ft and this side is perpendicular to the left side of the rectangle. The right side of the shaded region has a perpendicular line segment extending upward that is labeled 2 ft. At the top of this line segment is another line segment perpendicular to the right that reads 2 ft. At the end of this line segment is a perpendicular line segment extending upward that reads 1 ft. There is a line segment joining the end of this line segment with the top left corner of the rectangle. What is the area, in square feet, of the shaded region? What is the area, in square feet, of the non-shaded region?

Answers: 3


Another question on Mathematics
Mathematics, 21.06.2019 18:50
The avenues in a particular city run north to south and are numbered consecutively with 1st avenue at the western border of the city. the streets in the city run east to west and are numbered consecutively with 1st street at the southern border of the city. for a festival, the city is not allowing cars to park in a rectangular region bordered by 5th avenue to the west. 9th avenue to the east, 4th street to the south, and 6th street to the north. if x is the avenue number and yis the street number, which of the following systems describes the region in which cars are not allowed to park? 5th ave 9th ave
Answers: 1
Mathematics, 21.06.2019 19:00
2pointswhich of the following appear in the diagram below? check all that apply.d a. zcdeов. сеo c. aéo d. zdce
Answers: 1
Mathematics, 21.06.2019 21:00
Deepak plotted these points on the number line. point a: –0.3 point b: – 3 4 point c: – 11 4 point d: –0.7 which point did he plot incorrectly?
Answers: 2
Mathematics, 21.06.2019 21:30
What does independent variable and dependent variable mean in math?
Answers: 2
You know the right answer?
The figure below shows a shaded region and a non-shaded region. Angles in the figure that appear to...
Questions

Health, 08.12.2020 20:20
Mathematics, 08.12.2020 20:20


History, 08.12.2020 20:20

Arts, 08.12.2020 20:20

Mathematics, 08.12.2020 20:20

Social Studies, 08.12.2020 20:20
Mathematics, 08.12.2020 20:20
Mathematics, 08.12.2020 20:20
History, 08.12.2020 20:20
Mathematics, 08.12.2020 20:20
Health, 08.12.2020 20:20
Mathematics, 08.12.2020 20:20


