
Mathematics, 13.03.2020 19:45 kaybreezy
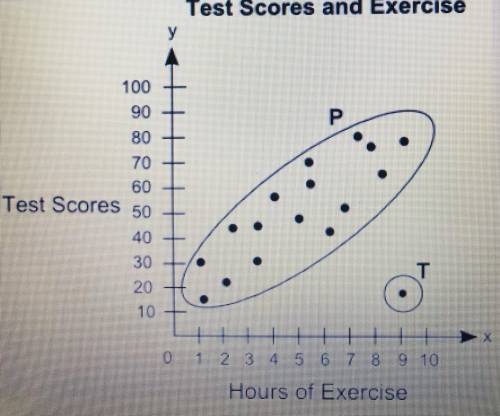
1)The scatter plot shows the relationship between the test scores of a group of students and the number of hours they exercise in a week:
Part A: what is the group of points P called? What is the point labeled T called? Give possible reason for the presence of point T
Part B: Describe the association between students test scores and the number of hours they exercise
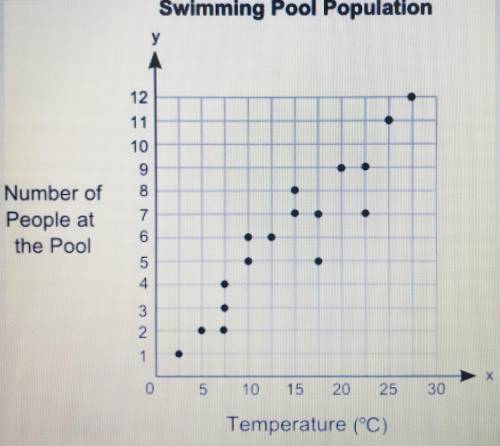
2:Meg plotted the graph below to show the relationship between the temperature of her city and the number of people at a swimming pool:
Part A: in your own words, describe the relationship between the temperature of the city of people at the swimming pool.
Part B: describe how you can male line of best fit. Write the approximate slope and y-intercept of the line of best fit. Show your work, including the points you use to calculate slope and y-intercept.
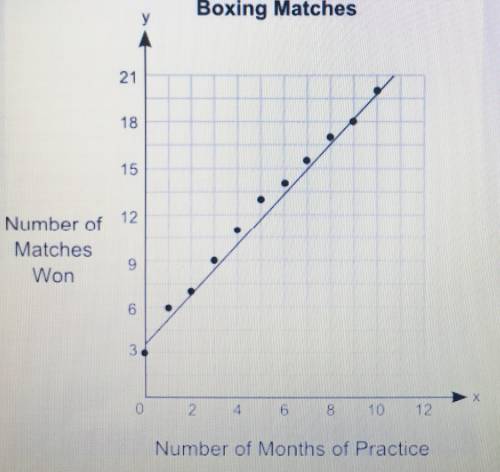
3) The graph shows the relationship between the number of months different students practiced boxing and the number of matches they won:
Part A: what is the approximate y-intercept of the line of best fit and what does line pf best fit and what does it represent?
Part B: Write the equation for the line of best fit in the slope-intercept form and use it to predict the number of matches that could be won after 13 months of practice. Show your work and include the points to calculate the slope
4) A group of students were surveyed to find out if they like building snowmen or skiing as a winter activity. The results of the survey are shown below:
60 students like building snowmen
10 students like building snowmen but do not like skiing
80 students like skiing
50 students do not like building snowmen
Make a two way table to represent the data and use the table to answer the following questions
Part A: What percentage of the total students surveyed like both building snowmen and skiing? Show your work
Part B: What is the probability that a student who does not like building snowmen also does not like skiing, Explain.

Answers: 3


Another question on Mathematics
Mathematics, 21.06.2019 20:30
If a 36 inch yardstick casts a 21 foot shadow, how tall is a building whose shadow is 168 feet? what is the scale factor
Answers: 1
Mathematics, 21.06.2019 22:30
What three-dimensional solid have 6 rectangular faces, 2 equal bases that are not rectangles and 18 edges
Answers: 3
Mathematics, 21.06.2019 23:00
Mr. rose asked his students to draw a quadrilateral with 4 unequal sides. draw an example of this kind of quadrilateral.
Answers: 2
Mathematics, 22.06.2019 02:20
Use the second shift theorem to find the inverse laplace transform of (e^−3s) / (s^2 + 2s − 3)
Answers: 1
You know the right answer?
1)The scatter plot shows the relationship between the test scores of a group of students and the num...
Questions


Social Studies, 20.12.2019 01:31


Computers and Technology, 20.12.2019 01:31
English, 20.12.2019 01:31
English, 20.12.2019 01:31


