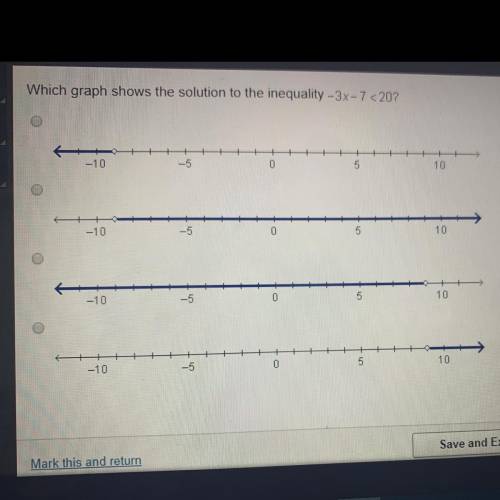
Which graph shows the solution to the inequality -3x-7 <20?
...

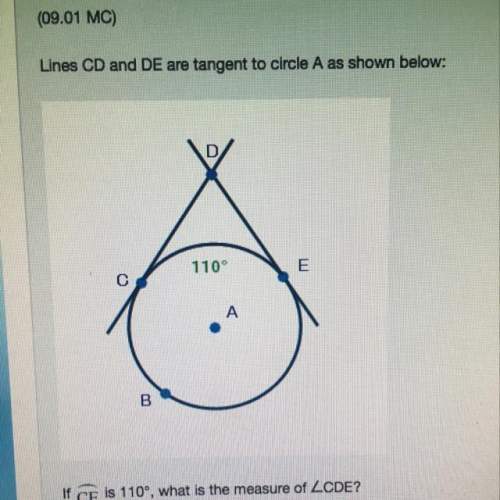
Mathematics, 14.03.2020 00:14 SunsetPrincess
Which graph shows the solution to the inequality -3x-7 <20?

Answers: 2


Another question on Mathematics
Mathematics, 21.06.2019 13:40
How do you use the additive inverse to evaluate an expression that uses subtraction in a full sentence
Answers: 3
Mathematics, 21.06.2019 16:30
11. minitab software was used to find the lsrl for a study between x=age and y=days after arthroscopic shoulder surgery until an athlete could return to their sport. use the output to determine the prediction model and correlation between these two variables. predictor coef se coef t p constant -5.054 4.355 -1.16 0.279 age 0.2715 0.1427 1.9 0.094 r-sq = 31.16%
Answers: 2
Mathematics, 21.06.2019 18:00
Jenisey has $24 to spend on seven pencils. after buying them she had $10. how much did each pencil cost.?
Answers: 1
Mathematics, 21.06.2019 19:30
The amount spent on food and drink by 20 customers is shown below what is the modal amount spent and the median amount spent? 40 25 8 36 18 15 24 27 43 9 12 19 22 34 31 20 26 19 17 28
Answers: 1
You know the right answer?
Questions

Physics, 15.07.2019 02:30
Mathematics, 15.07.2019 02:30
Mathematics, 15.07.2019 02:30
Mathematics, 15.07.2019 02:30


History, 15.07.2019 02:30


English, 15.07.2019 02:30
English, 15.07.2019 02:30
English, 15.07.2019 02:30


