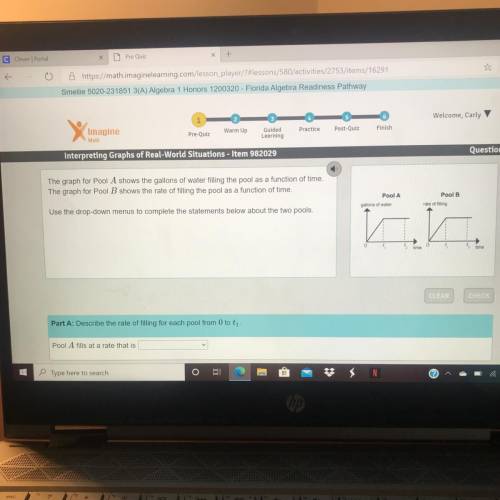
The graph for Pool A shows the gallons of water filling the pool as a function of time.
The gr...

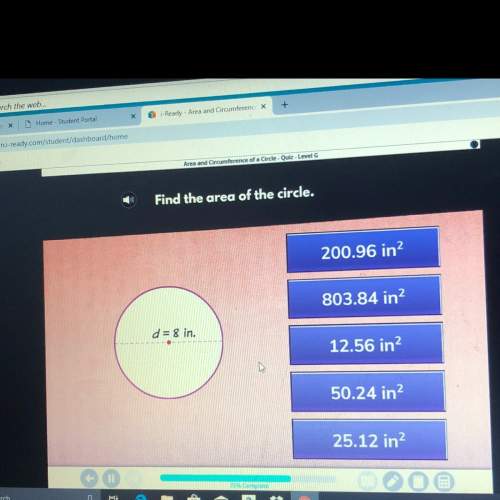
Mathematics, 16.03.2020 20:25 erin2077
The graph for Pool A shows the gallons of water filling the pool as a function of time.
The graph for Pool B shows the rate of filling the pool as a function of time.
Use the drop-down menus to complete the statements below about the two pools

Answers: 2


Another question on Mathematics
Mathematics, 21.06.2019 19:00
Identify the type of observational study described. a statistical analyst obtains data about ankle injuries by examining a hospital's records from the past 3 years. cross-sectional retrospective prospective
Answers: 2
Mathematics, 21.06.2019 19:30
Me. i can't figure out this question. give an explanation too. .
Answers: 1
Mathematics, 21.06.2019 22:00
You buy 4 items that cost 2.69 14.45 8.05 13.95 what is the estimated total round to the nearest dollar
Answers: 1
You know the right answer?
Questions
Mathematics, 08.12.2019 01:31

World Languages, 08.12.2019 01:31


Social Studies, 08.12.2019 01:31

Spanish, 08.12.2019 01:31
Social Studies, 08.12.2019 01:31
Mathematics, 08.12.2019 01:31

Biology, 08.12.2019 01:31

Mathematics, 08.12.2019 01:31
Mathematics, 08.12.2019 01:31

History, 08.12.2019 01:31
Biology, 08.12.2019 01:31
Chemistry, 08.12.2019 01:31


