Mathematics, 16.03.2020 21:11 ana2896
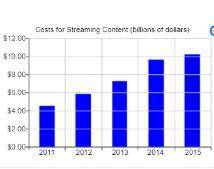
A newspaper used a chart resembling the one to the right to illustrate the rising amounts that a video rental company spends to provide streaming content online. Is this the bar chart of a categorical variable, or is it a timeplot that uses bars to show the data?

Answers: 2


Another question on Mathematics

Mathematics, 21.06.2019 14:10
An energy plant is looking into putting in a system to remove harmful pollutants from its emissions going into earth's atmosphere. the cost of removing the pollutants can be modeled using the function c = 25000p/100 -p what is the vertical asymptote?
Answers: 1

Mathematics, 21.06.2019 16:00
()1. how do you find range? 2.the following set of data is to be organized into a histogram. if there are to be five intervals on the graph, what should the length of each interval be? 30, 34, 23, 21, 27, 25, 29, 29, 25, 23, 32, 31
Answers: 1

Mathematics, 21.06.2019 18:00
In the polynomial below, what number should replace the question mark to produce a difference of squares? x2 + ? x - 36
Answers: 3

Mathematics, 21.06.2019 18:40
Valentina is subtracting from . she finds the lcd to be 15y2. what is valentina's next step?
Answers: 2
You know the right answer?
A newspaper used a chart resembling the one to the right to illustrate the rising amounts that a vid...
Questions


Mathematics, 10.07.2019 17:10


