
Mathematics, 16.03.2020 21:20 ThePotato381
Consider the following data set. The data were actually collected in pairs, and each row represents a pair.
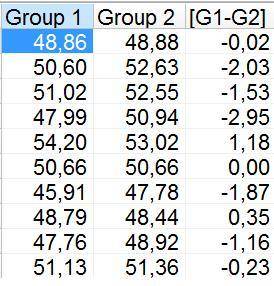
Group 1 Group 2
48.86 48.88
50.6 52.63
51.02 52.55
47.99 50.94
54.2 53.02
50.66 50.66
45.91 47.78
48.79 48.44
47.76 48.92
51.13 51.63
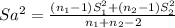
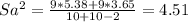
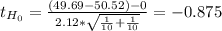
a. Suppose that we ignore the fact that the data were collected in pairs and mistakenly treat this as a two-sample problem. Compute the sample mean and variance for each group. Then compute the two-sample t statistic, degrees of freedom, and P-value for the two-sided alternative.
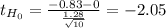
b. Now analyze the data in the proper way. Compute the sample mean and variance of the differences. Then compute the t statistic, degrees of freedom, and P-value.
c. Describe the differences in the two test results.

Answers: 2
![t=\frac{(X[bar]_1-X[bar]_2)-(Mu_1-Mu_2)}{Sa\sqrt{\frac{1}{n_1} +\frac{1}{n_2} } } ~~t_{n_1+n_2-2}](/tpl/images/0549/2049/5828a.png)
 ≤-0.875) + P(
![t= \frac{X[bar]d-Mud}{\frac{Sd}{\sqrt{n} } } ~~t_{n-1}](/tpl/images/0549/2049/7de66.png)
 ≤-2.05) + P(
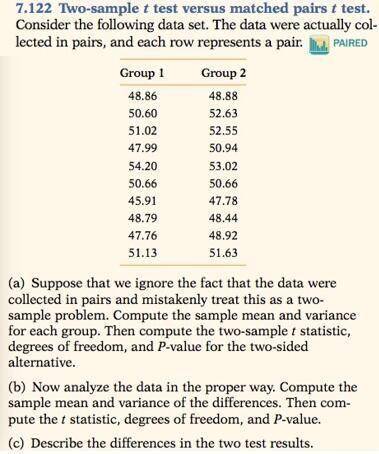


Another question on Mathematics
Mathematics, 21.06.2019 14:30
If anyone has done the algebra 2 chaos theory portfolio would you be wiling to me? i kind of know what i'm doing i just don't know if i'm doing it right.
Answers: 1
Mathematics, 21.06.2019 15:00
Which of the binomials below is a factor of this trinominal? x^2-13+30
Answers: 2
Mathematics, 21.06.2019 15:30
Choose a second initial value that is 0.01 greater than the initial value from question 9. iterate it using the function, f, ten times. if necessary, you can round your results to the nearest ten-thousandth.
Answers: 2
Mathematics, 21.06.2019 16:10
Each equation given below describes a parabola. which statement best compares their graphs? x = 2y^2 x = 8y^2
Answers: 2
You know the right answer?
Consider the following data set. The data were actually collected in pairs, and each row represents...
Questions

French, 30.12.2020 14:00

Social Studies, 30.12.2020 14:00

English, 30.12.2020 14:00


Business, 30.12.2020 14:00
Mathematics, 30.12.2020 14:00
Mathematics, 30.12.2020 14:00
Social Studies, 30.12.2020 14:00
Mathematics, 30.12.2020 14:00
Social Studies, 30.12.2020 14:00


Computers and Technology, 30.12.2020 14:00
Mathematics, 30.12.2020 14:10
Mathematics, 30.12.2020 14:10
History, 30.12.2020 14:10
English, 30.12.2020 14:10


