
Mathematics, 17.03.2020 03:02 Fdl52417
An outbreak of the deadly Ebola virus in 2002 and 2003 killed 91 of the 95 gorillas in 7 home ranges in the Congo. To study the spread of the virus, measure distance by the number of home ranges separating a group of gorillas from the first group infected. Here are data on distance and number of days until deaths began in each later group:
Distance x 1 4 6 6 6 7
Days y 2 20 29 38 44 50
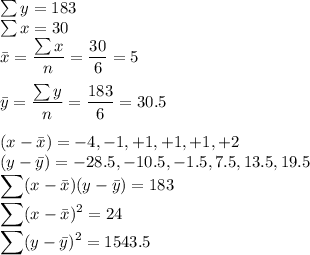
Find the correlation r between x and y.
r = ?

Answers: 2


Another question on Mathematics
Mathematics, 22.06.2019 01:00
Which of the following values in the set below will make the equation 5x + 6 = 6 true? (only input the number.) {0, 1, 2, 3, 4}
Answers: 2
Mathematics, 22.06.2019 01:30
(01.03 mc) which of the following is a step in simplifying the expression x multiplied by y to the power of 2 over x to the power of negative 3 multiplied by y to the power of 3, the whole to the power of negative 4. select one: a. x to the power of negative 4 multiplied by y to the power of negative 2, the whole over x to the power of negative 7 multiplied by y to the power of negative 1. b. x to the power of negative 4 multiplied by y to the power of negative 8, the whole over x to the power of 12 multiplied by y to the power of negative 12. c. x to the power of negative 4 multiplied by y to the power of negative 8, the whole over x to the power of negative 3 multiplied by y to the power of 3. d. x to the power of negative 4 multiplied by y to the power of negative 2, the whole over x to the power of negative 3 multiplied by y to the power of 3.
Answers: 3
Mathematics, 22.06.2019 01:30
Given are five observations for two variables, x and y. xi 1 2 3 4 5 yi 3 7 5 11 14 which of the following is a scatter diagrams accurately represents the data? what does the scatter diagram developed in part (a) indicate about the relationship between the two variables? try to approximate the relationship betwen x and y by drawing a straight line through the data. which of the following is a scatter diagrams accurately represents the data? develop the estimated regression equation by computing the values of b 0 and b 1 using equations (14.6) and (14.7) (to 1 decimal). = + x use the estimated regression equation to predict the value of y when x = 4 (to 1 decimal). =
Answers: 3
You know the right answer?
An outbreak of the deadly Ebola virus in 2002 and 2003 killed 91 of the 95 gorillas in 7 home ranges...
Questions


Mathematics, 10.04.2020 00:59

Chemistry, 10.04.2020 00:59

Biology, 10.04.2020 00:59

Social Studies, 10.04.2020 00:59
Mathematics, 10.04.2020 00:59
History, 10.04.2020 01:00
Physics, 10.04.2020 01:00
Mathematics, 10.04.2020 01:00
Mathematics, 10.04.2020 01:00


