
Mathematics, 17.03.2020 20:12 kaylam5599
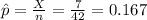
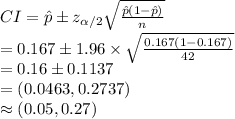
1. The data given below includes data from 42 candies, and 7 of them are red. The company that makes the candy claims that 33% of its candies are red. Use the sample data to construct a 95% confidence interval estimate of the percentage of red candies. What do you conclude about the claim of 33%?
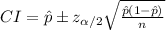
2. Construct a 95 % confidence interval estimate of the population percentage of candies that are red.
Weights (g) of a Sample Bag of Candy
Red Blue Brown Green Yellow
0.792 0.982 0.765 0.738 0.837
0.942 0.769 0.745 0.823 0.719
0.906 0.997 0.897 0.729 0.796
0.941 0.877 0.816 0.866 0.712
0.959 0.788 0.902 0.792 0.704
0.976 0.965 0.956 0.983
0.809 0.999 0.846
0.849 0.986 0.834
0.955 0.845
0.736
0.721

Answers: 2


Another question on Mathematics
Mathematics, 21.06.2019 19:30
He mass of a single atom of carbon can be found by dividing the atomic mass (12.01 g) by 6.022 x 10^23. which is the mass of a single carbon atom, correctly written in scientific notation with the correct number of significant figures?
Answers: 1
Mathematics, 21.06.2019 22:30
60 musicians applied for a job at a music school. 14 of the musicians play both guitar and drums. what is the probability that the applicant who gets the job plays drums or guitar?
Answers: 1
Mathematics, 22.06.2019 02:00
The function h (t) = -16t squared + 28t + 500 represents the height of a rock t seconds after it's propelled by a slingshot what does h (3.2) represent?
Answers: 1
Mathematics, 22.06.2019 02:30
Using the rise/run counting method, the slope of the line is
Answers: 1
You know the right answer?
1. The data given below includes data from 42 candies, and 7 of them are red. The company that makes...
Questions

History, 31.10.2019 07:31
History, 31.10.2019 07:31

Social Studies, 31.10.2019 07:31

Mathematics, 31.10.2019 07:31

Biology, 31.10.2019 07:31
English, 31.10.2019 07:31
History, 31.10.2019 07:31

Health, 31.10.2019 07:31
Social Studies, 31.10.2019 07:31
Mathematics, 31.10.2019 07:31
Mathematics, 31.10.2019 07:31
Mathematics, 31.10.2019 07:31

World Languages, 31.10.2019 07:31


