
Mathematics, 18.03.2020 07:01 krizzle168
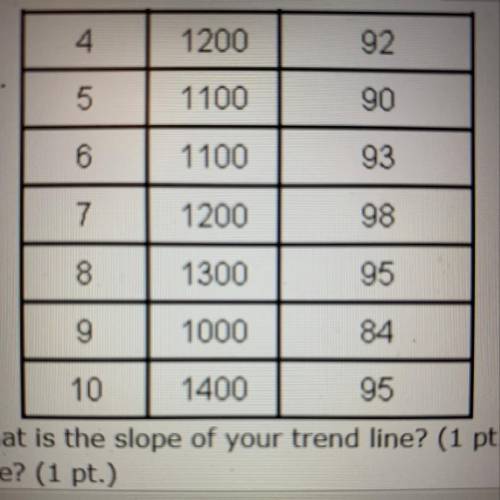
You have collected data on 10 seniors at your high school to determine if SAT scores can help predict success in the calculus course. Construct a scatter plot if this data and draw a trend line.
A. Is the data correlation positive, negative or no correlation?
B. What is the slope of your trend line?
C. What is the equation for your trend line?
D. If you have 1150 on your SAT, what do you predict your final score in calculus to be?

Answers: 2


Another question on Mathematics
Mathematics, 21.06.2019 14:00
Initially 100 milligrams of a radioactive substance was present. after 6 hours the mass had decreased by 4%. if the rate of decay is proportional to the amount of the substance present at time t, find the amount remaining after 24 hours. (round your answer to one decimal place.)
Answers: 3
Mathematics, 21.06.2019 16:30
What is true about the dilation? it is a reduction with a scale factor between 0 and 1. it is a reduction with a scale factor greater than 1. it is an enlargement with a scale factor between 0 and 1. it is an enlargement with a scale factor greater than 1.
Answers: 2
Mathematics, 21.06.2019 19:10
Which graph represents the function g(x) = |x + 4| + 2?
Answers: 1
Mathematics, 21.06.2019 20:30
Find the magnitude, correct to two decimal places, made by each of the following with positive direction of the x axis a) y= x the answer is 45° but i don’t know how
Answers: 2
You know the right answer?
You have collected data on 10 seniors at your high school to determine if SAT scores can help predic...
Questions

Law, 22.09.2020 04:01

Mathematics, 22.09.2020 04:01
Mathematics, 22.09.2020 04:01
Mathematics, 22.09.2020 04:01

History, 22.09.2020 04:01
Mathematics, 22.09.2020 04:01

Mathematics, 22.09.2020 04:01
History, 22.09.2020 04:01
Mathematics, 22.09.2020 04:01
English, 22.09.2020 04:01

Mathematics, 22.09.2020 04:01

Mathematics, 22.09.2020 04:01


