1.
(06.01 MC)
The scatter plot shows the relationship between the test scores of a...

Mathematics, 20.03.2020 01:39 blackwell0315
1.
(06.01 MC)
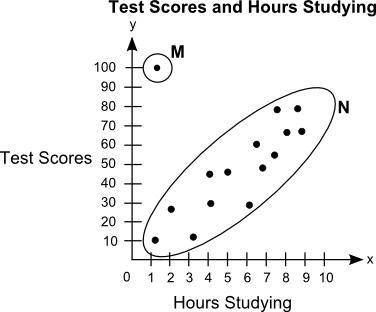
The scatter plot shows the relationship between the test scores of a group of students and the number of hours they study in a week:
On a grid, Label Hours Studying on x axis and Test Scores on y axis. The title of the graph is Test Scores and Hours Studying. The scale on the x axis shows the numbers from 0 to 10 at increments of 1, and the scale on the y axis shows numbers from 0 to 100 at increments of 10. Dots are made at the ordered pairs 1.1, 10 and 2, 25 and 3.1, 10.1 and 4, 30 and 4, 45 and 5, 45 and 6, 25 and 6.5, 60 and 7, 45 and 7.5, 50 and 7.5, 75 and 8, 60 and 8.5, 75 and 9, 60. The ordered pair 1, 100 is circled and labeled as M. All the other points are put in an oval and labeled as N.
Part A: What is the group of points labeled N called? What is the point labeled M called? Give a possible reason for the presence of point M. (5 points)
Part B: Describe the association between students' test scores and the number of hours they study. (5 points)

Answers: 3


Another question on Mathematics
Mathematics, 21.06.2019 19:00
Rob spent 25%, percent more time on his research project than he had planned. he spent an extra h hours on the project. which of the following expressions could represent the number of hours rob actually spent on the project? two answers
Answers: 3
Mathematics, 22.06.2019 00:00
Find the percent cost of the total spent on each equipment $36, fees $158, transportation $59 a. 14%, 62%, 23% b. 15%, 60%, 35% c. 10%, 70%, 20% d. 11%, 62%, 27%
Answers: 3
You know the right answer?
Questions


Mathematics, 22.11.2021 14:00
Mathematics, 22.11.2021 14:00


