
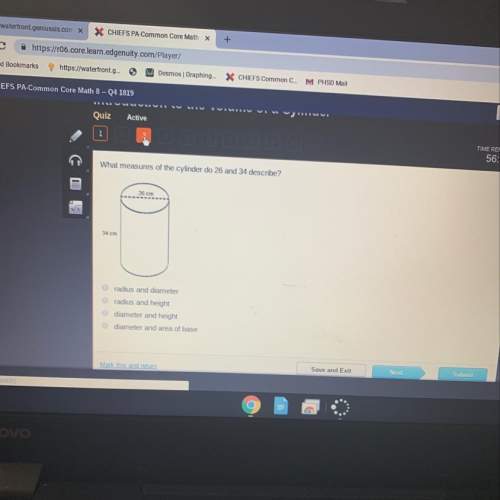
Mathematics, 20.03.2020 09:50 caprisun1440
The box plot shows the number of raisins found in sample boxes from Brand C and from Brand D. Each box weighs the same. What could you infer by comparing the range of the data for each brand?
A) A box of raisins from either brand has about 28 raisins.
B) The number of raisins in boxes from Brand C varies more than boxes from Brand D.
C) The number of raisins in boxes from Brand D varies more than boxes from Brand C.
D) The number of raisins in boxes from either brand varies about the same.

Answers: 2


Another question on Mathematics
Mathematics, 21.06.2019 14:30
The number of revolutions of two pulleys is inversely proportional to their diameters. if a 24-inch diameter pulley making 400 revolutions per minute is belted to an 8-inch diameter pulley, find the number of revolutions per minute of the smaller pulley.
Answers: 1
Mathematics, 21.06.2019 17:00
Tom had a total of $220 and he spent $35 on a basketball ticket . what percent of his money did he have left?
Answers: 1
Mathematics, 21.06.2019 18:00
Pat listed all the numbers that have 15 as a multiple write the numbers in pats list
Answers: 3
Mathematics, 21.06.2019 18:30
Can someone check if i did this right since i really want to make sure it’s correct. if you do you so much
Answers: 1
You know the right answer?
The box plot shows the number of raisins found in sample boxes from Brand C and from Brand D. Each b...
Questions

Mathematics, 10.10.2020 18:01
Mathematics, 10.10.2020 18:01
Mathematics, 10.10.2020 18:01


History, 10.10.2020 18:01

Computers and Technology, 10.10.2020 19:01
Mathematics, 10.10.2020 19:01

Mathematics, 10.10.2020 19:01
Mathematics, 10.10.2020 19:01


