Complete each of the following.
a. Graph each function by making a table of values.
b. D...

Mathematics, 20.03.2020 22:40 kaylatunell123
Complete each of the following.
a. Graph each function by making a table of values.
b. Determine the consecutive values of x between which each real zero is located.
c. Estimate the x-coordinates at which the relative maxima and minima occur.
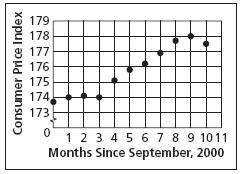
PRICES The Consumer Price Index (CPI) gives the relative price for a fixed set of goods and services. The CPI from September 2000 to July 2001 is shown in the graph.
Source: U. S. Bureau of Labor Statistics
a. Describe the turning points of the graph.
b. If the graph were modeled by a polynomial equation, what is the least degree the equation could have?

Answers: 2


Another question on Mathematics
Mathematics, 21.06.2019 13:10
(a) solve h+2/6 = h-3/4(b) solve the following simultaneous equations. 2x = y + 66x - 2y = 13x = ? y = ?
Answers: 1
Mathematics, 21.06.2019 16:00
Select the correct answer. in the figure, angle k measures 45°. what is the measurement of angle c? a. 38° b. 45° c. 90° d. 98°
Answers: 2
Mathematics, 21.06.2019 16:30
An equation where variables are used to represent known values—function notation true or false
Answers: 2
Mathematics, 21.06.2019 17:30
Arecipe uses 2 cups of sugar to make 32 brownies. how many cups of sugar are needed to make 72 brownies?
Answers: 1
You know the right answer?
Questions


Computers and Technology, 05.11.2020 18:50


Mathematics, 05.11.2020 18:50


Biology, 05.11.2020 18:50
English, 05.11.2020 18:50

Mathematics, 05.11.2020 18:50


