plot the ordered pairs :

Mathematics, 02.09.2019 16:30 mutoni55
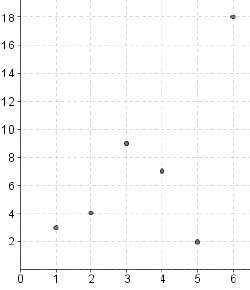
The graph below plots the values of y for different values of x:
plot the ordered pairs :
1, 3 and 2, 4 and 3, 9 and 4, 7 and 5, 2 and 6, 18
which correlation coefficient best matches the data plotted on the graph?
0.5
0.8
0.9
1.0

Answers: 2


Another question on Mathematics
Mathematics, 21.06.2019 16:00
What were mkh company's cash flows from (for) operating activities in 20x1? $(180,300) $233,100 $268,200 $279,400?
Answers: 2
Mathematics, 21.06.2019 16:30
Hillel is juggling flaming torches to raise money for charity. his initial appearance raises $500\$500 $500 , and he raises $15\$15 $15 for each minute of juggling performance. the amount rr r of money hillel raises is a function of tt t , the length of his performance in minutes. write the function's formula.
Answers: 1
Mathematics, 21.06.2019 18:00
What is the equation of this graphed line? enter your answer in slope-intercept form in the box.
Answers: 2
Mathematics, 21.06.2019 18:40
What value of x is in the solution set of 4x – 12 s 16 + 8x?
Answers: 3
You know the right answer?
The graph below plots the values of y for different values of x:
plot the ordered pairs :
plot the ordered pairs :
Questions


Social Studies, 22.02.2022 14:00
Social Studies, 22.02.2022 14:00
Mathematics, 22.02.2022 14:00
Mathematics, 22.02.2022 14:00


Physics, 22.02.2022 14:00
Business, 22.02.2022 14:00
Mathematics, 22.02.2022 14:00
Chemistry, 22.02.2022 14:00


