
Mathematics, 23.03.2020 22:56 u8p4
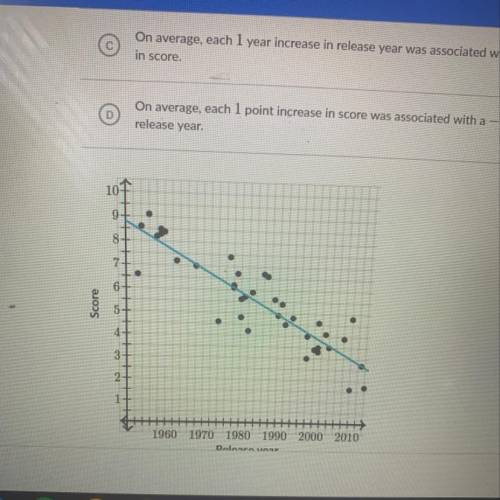
Surya gave each member of his family a different playlist of random songs to listen to and asked them to
rank each song between 0 and 10. He compared his family's rankings with the release year of each song
and created the following scatterplot and regression line.
The fitted line has a slope of -0.096.
What is the best interpretation of this slope?
Choose 1
A song released in 1950 would have a rating of about 8.75.
(B)
A song released in 1950 would have a rating of -0.096.
On average, each 1 year increase in release year was associated with a -0.096 point change
in score.
On average, each 1 point increase in score was associated with a -0.096 year change in
release year.

Answers: 2


Another question on Mathematics
Mathematics, 21.06.2019 17:30
Janet drove 300 miles in 4.5 hours. write an equation to find the rate at which she was traveling
Answers: 2
Mathematics, 21.06.2019 18:30
Ricky takes out a $31,800 student loan to pay his expenses while he is in college. after graduation, he will begin making payments of $190.66 per month for the next 30 years to pay off the loan. how much more will ricky end up paying for the loan than the original value of $31,800? ricky will end up paying $ more than he borrowed to pay off the loan.
Answers: 2
Mathematics, 21.06.2019 20:00
The scatterplot below shows the number of hours that students read weekly and the number of hours that they spend on chores weekly. which statement about the scatterplot is true?
Answers: 2
You know the right answer?
Surya gave each member of his family a different playlist of random songs to listen to and asked the...
Questions
Mathematics, 08.04.2020 23:05

Computers and Technology, 08.04.2020 23:06

Chemistry, 08.04.2020 23:06


Spanish, 08.04.2020 23:06

Mathematics, 08.04.2020 23:06

Mathematics, 08.04.2020 23:06
Biology, 08.04.2020 23:06
Mathematics, 08.04.2020 23:06
Mathematics, 08.04.2020 23:06
English, 08.04.2020 23:06


