
Mathematics, 24.03.2020 03:52 pupucitomarron
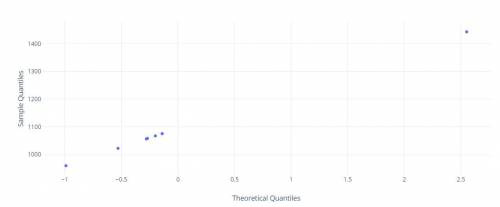
A sample of human brain volumes (cm3) is given below. Use the given data values to identify the corresponding z scores that are used for a normal quantile plot, then identify the coordinates of each point in the normal quantile plot. Construct the normal quantile plot, then determine whether the data appear to be from a population with a normal distribution. 1067 1075 1056 1022 1075 1443 959 1058 List the z scores for the normal quantile plot.

Answers: 3


Another question on Mathematics
Mathematics, 21.06.2019 22:00
The evening newspaper is delivered at a random time between 5: 30 and 6: 30 pm. dinner is at a random time between 6: 00 and 7: 00 pm. each spinner is spun 30 times and the newspaper arrived 19 times before dinner. determine the experimental probability of the newspaper arriving before dinner.
Answers: 1
Mathematics, 22.06.2019 00:00
The function y= x - 4x+ 5 approximates the height, y, of a bird, and its horizontal distance, x, as it flies from one fence post to another. all distances are in feet. complete the square to find and interpret the extreme value (vertex). select two answers: one extreme value and one interpretation.
Answers: 2
You know the right answer?
A sample of human brain volumes (cm3) is given below. Use the given data values to identify the corr...
Questions
Mathematics, 18.08.2019 16:20


Mathematics, 18.08.2019 16:20

Health, 18.08.2019 16:20
Mathematics, 18.08.2019 16:20
History, 18.08.2019 16:20

Chemistry, 18.08.2019 16:20

Mathematics, 18.08.2019 16:20
Mathematics, 18.08.2019 16:20

Social Studies, 18.08.2019 16:20


