
Mathematics, 24.03.2020 22:19 Janupedia
Below are three different hypothesis tests about population proportions. For each test, use StatKey and the information given to calculate the appropriate p-value and make the correct conclusion.
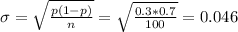
(1) H0: p = 0.3 vs Ha: p ? 0.3. In their survey, they had a count of 38 using a sample size n=100.
1.a) What is p-hat for this sample?
Using StatKey, generate a randomization distribution using at least 4000 samples. Remember to select Edit Data to input sample information, and to edit the null hypothesis.
1.b) What is the p-value using this randomization distribution?
1.c) At a significance level of 0.05, what is the conclusion for this hypothesis test?
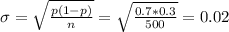
(2) H0: p = 0.7 vs Ha: p ? 0.7. In their survey, they had a count of 320 using a sample size n=500.
2.a) What is p-hat for this sample?
Using StatKey, generate a randomization distribution using at least 4000 samples. Remember to select Edit Data to input sample information, and to edit the null hypothesis.
2.b) What is the p-value using this randomization distribution?
2.c) At a significance level of 0.05, what is the conclusion for this hypothesis test?
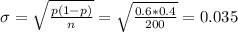
(3) H0: p = 0.6 vs Ha: p < 0.6. In their survey, they had a count of 110 using a sample size n=200.
3.a) What is p-hat for this sample?
Using StatKey, generate a randomization distribution using at least 4000 samples. Remember to select Edit Data to input sample information, and to edit the null hypothesis.
3.b) What is the p-value using this randomization distribution?
3.c) At a significance level of 0.05, what is the conclusion for this hypothesis test?

Answers: 1


Another question on Mathematics
Mathematics, 21.06.2019 19:00
Write the pair of fractions as a pair of fractions with a common denominator
Answers: 3
Mathematics, 21.06.2019 19:20
Which letters from the table represent like terms? a and b b and c a and d b and d
Answers: 3
Mathematics, 21.06.2019 20:00
Which of the following is an equation of a line parallel to the equation y=4x+1?
Answers: 1
Mathematics, 21.06.2019 20:00
How does the graph of g(x)=⌊x⌋−3 differ from the graph of f(x)=⌊x⌋? the graph of g(x)=⌊x⌋−3 is the graph of f(x)=⌊x⌋ shifted right 3 units. the graph of g(x)=⌊x⌋−3 is the graph of f(x)=⌊x⌋ shifted up 3 units. the graph of g(x)=⌊x⌋−3 is the graph of f(x)=⌊x⌋ shifted down 3 units. the graph of g(x)=⌊x⌋−3 is the graph of f(x)=⌊x⌋ shifted left 3 units.
Answers: 1
You know the right answer?
Below are three different hypothesis tests about population proportions. For each test, use StatKey...
Questions

English, 16.07.2019 05:30

Mathematics, 16.07.2019 05:30

English, 16.07.2019 05:30

Geography, 16.07.2019 05:30

English, 16.07.2019 05:30
Biology, 16.07.2019 05:30

History, 16.07.2019 05:30


