
Mathematics, 24.03.2020 23:15 ghwolf4p0m7x0
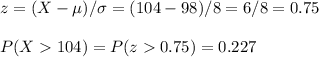
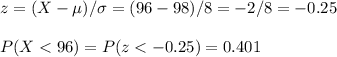
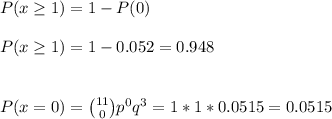
An Xത chart with three-sigma limits has parameters as follows: UCL = 104; Center Line = 100; LCL = 96; n = 5 Suppose the process quality characteristic being controlled is normally distributed with a true mean of 98 and a standard deviation of 8. What is the probability that the control chart would exhibit lack of control by at least the third point plotted?

Answers: 1


Another question on Mathematics
Mathematics, 21.06.2019 19:00
Ab based on the given diagram, if m_1 = 60° then m 2 = 30 60 90 180
Answers: 1
Mathematics, 21.06.2019 20:30
Kayla made observations about the sellin price of a new brand of coffee that sold in the three different sized bags she recorded those observations in the following table 6 is $2.10 8 is $2.80 and 16 is to $5.60 use the relationship to predict the cost of a 20oz bag of coffee.
Answers: 3
You know the right answer?
An Xത chart with three-sigma limits has parameters as follows: UCL = 104; Center Line = 100; LCL = 9...
Questions
Mathematics, 29.05.2020 19:02
Mathematics, 29.05.2020 19:02
Mathematics, 29.05.2020 19:02

Biology, 29.05.2020 19:02
Mathematics, 29.05.2020 19:02

Social Studies, 29.05.2020 19:03


Computers and Technology, 29.05.2020 19:03
Mathematics, 29.05.2020 19:03
Mathematics, 29.05.2020 19:03
English, 29.05.2020 19:03
Mathematics, 29.05.2020 19:03

Mathematics, 29.05.2020 19:03


