
Mathematics, 20.12.2019 09:31 eddyjunior679
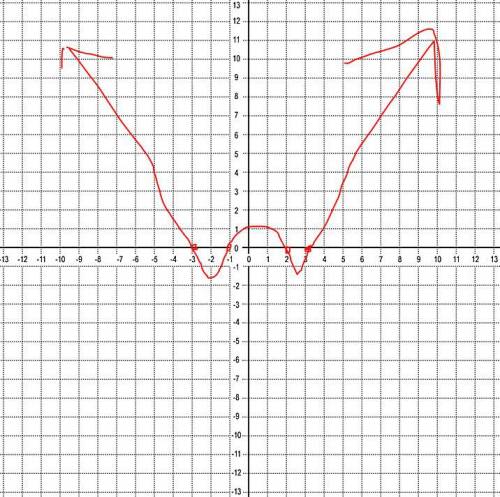
Function p(x) = x4 − x3 − 11x2 + 9x + 18. describe to the ceo what the graph looks like and, in general, how to sketch the graph without using technology. use complete sentences, and focus on the end behaviors of the graph and where the company will break even (where p(x) = 0). (10 points)

Answers: 2


Another question on Mathematics
Mathematics, 21.06.2019 19:00
Solve the equation using the zero-product property. -3n(7n - 5) = 0 a. 0, -5/7 b. -1/3, -5/7 c. -1/3, 5/7 d. 0, 5/7
Answers: 2
Mathematics, 21.06.2019 20:00
The scatterplot below shows the number of hours that students read weekly and the number of hours that they spend on chores weekly. which statement about the scatterplot is true?
Answers: 2
You know the right answer?
Function p(x) = x4 − x3 − 11x2 + 9x + 18. describe to the ceo what the graph looks like and, in gene...
Questions

German, 10.02.2021 01:00
Mathematics, 10.02.2021 01:00
Mathematics, 10.02.2021 01:00
Mathematics, 10.02.2021 01:00


Mathematics, 10.02.2021 01:00

Mathematics, 10.02.2021 01:00
Mathematics, 10.02.2021 01:00
History, 10.02.2021 01:00


Arts, 10.02.2021 01:00


