The line graph above shows the monthly rainfall from March to October
last year in Chestnut Ci...

Mathematics, 25.03.2020 16:41 kam645
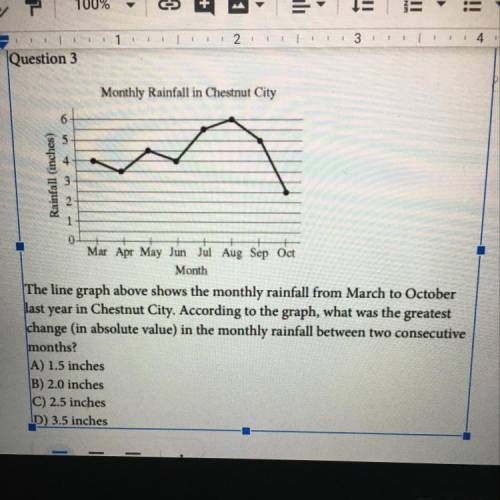
The line graph above shows the monthly rainfall from March to October
last year in Chestnut City. According to the graph, what was the greatest
change (in absolute value) in the monthly rainfall between two consecutive
months?
A) 1.5 inches
B) 2.0 inches
C) 2.5 inches
D) 3.5 inches


Answers: 3


Another question on Mathematics

Mathematics, 21.06.2019 16:20
He concluded that a heavier object dropped from the same height as a lighter object will land
Answers: 2

Mathematics, 21.06.2019 17:00
Line gh passes through points (2, 5) and (6, 9). which equation represents line gh? y = x + 3 y = x – 3 y = 3x + 3 y = 3x – 3
Answers: 1

Mathematics, 22.06.2019 01:00
Drag statements and reasons to each row to show why the slope of the line between d and e is the same as the slope between e and f, given that triangles a and b are similar.
Answers: 2

Mathematics, 22.06.2019 01:30
Simplify 1/3 12x - 6 a. -2x-1 b.-2x-8 c.-x+4 d.3x+10 e. 4x-2
Answers: 1
You know the right answer?
Questions


Mathematics, 01.12.2021 14:00


History, 01.12.2021 14:00

Computers and Technology, 01.12.2021 14:00

Mathematics, 01.12.2021 14:00

Mathematics, 01.12.2021 14:00


Mathematics, 01.12.2021 14:00

Mathematics, 01.12.2021 14:00

Health, 01.12.2021 14:00


Health, 01.12.2021 14:00


Health, 01.12.2021 14:00

Mathematics, 01.12.2021 14:00

Mathematics, 01.12.2021 14:00


