Mathematics, 26.03.2020 21:38 mdndndndj2981
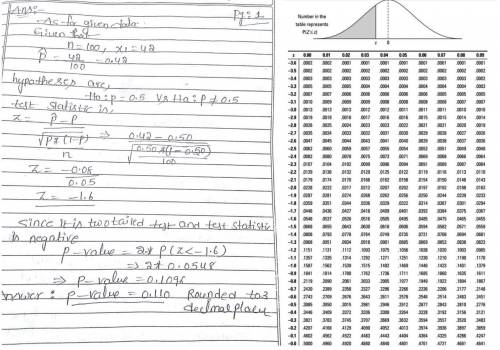
The null and alternative hypotheses for a population proportion, as well as the sample results, are given. Use StatKey or other technology to generate a randomization distribution and calculate a p-value. StatKey tip: Use "Test for a Single Proportion" and then "Edit Data" to enter the sample information. Hypotheses: H0:p=0.6 vs Ha:p> 0.6; Sample data: p^=5280=0.65 with n=80 Round the p-value to three decimal places.

Answers: 3


Another question on Mathematics

Mathematics, 21.06.2019 20:00
Which of these numbers of simulations of an event would be most likely to produce results that are closest to those predicted by probability theory? 15, 20, 5, 10
Answers: 2


Mathematics, 22.06.2019 02:30
Atrain traveled for 1.5 hours to the first station, stopped for 30 minutes, then traveled for 4 hours to the final station where it stopped for 1 hour. the total distance traveled is a function of time. which graph most accurately represents this scenario? a graph is shown with the x-axis labeled time (in hours) and the y-axis labeled total distance (in miles). the line begins at the origin and moves upward for 1.5 hours. the line then continues upward at a slow rate until 2 hours. from 2 to 6 hours, the line continues quickly upward. from 6 to 7 hours, it moves downward until it touches the x-axis a graph is shown with the axis labeled time (in hours) and the y axis labeled total distance (in miles). a line is shown beginning at the origin. the line moves upward until 1.5 hours, then is a horizontal line until 2 hours. the line moves quickly upward again until 6 hours, and then is horizontal until 7 hours a graph is shown with the axis labeled time (in hours) and the y-axis labeled total distance (in miles). the line begins at the y-axis where y equals 125. it is horizontal until 1.5 hours, then moves downward until 2 hours where it touches the x-axis. the line moves upward until 6 hours and then moves downward until 7 hours where it touches the x-axis a graph is shown with the axis labeled time (in hours) and the y-axis labeled total distance (in miles). the line begins at y equals 125 and is horizontal for 1.5 hours. the line moves downward until 2 hours, then back up until 5.5 hours. the line is horizontal from 5.5 to 7 hours
Answers: 1

Mathematics, 22.06.2019 04:50
What is the measure of ac? enter your answer in the box. (4x - 5.5) (5x+25)
Answers: 1
You know the right answer?
The null and alternative hypotheses for a population proportion, as well as the sample results, are...
Questions


Mathematics, 29.10.2019 07:31


Biology, 29.10.2019 07:31


Mathematics, 29.10.2019 07:31

Health, 29.10.2019 07:31


Business, 29.10.2019 07:31


History, 29.10.2019 07:31


