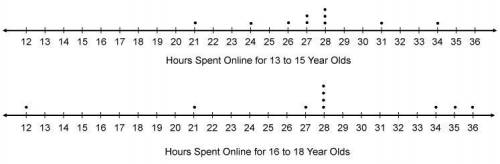
The line plots show the number of hours two groups of teens spent online last week.
How d...

Mathematics, 27.03.2020 20:49 Rosalycarlite5358
The line plots show the number of hours two groups of teens spent online last week.
How does the data compare for the two groups of teens?
The mode for the hours spent online for the 13- to 15-year olds is greater than the mode for the hours last week for the 16- to 18-year olds.
The 16- to 18-year olds spent about the same hours online, on average, as the 13- to 15-year olds.
The range of hours spent online for the 13- to 15-year olds is greater than the range of hours spent online for the 16- to 18-year olds.
The median value for the hours spent online for the 13- to 15-year olds is greater than the median value for the hours spent online for the 16- to 18- year olds.
Two dot plots titled Hours Spent Online for Thirteen to Fifteen-Year-Olds and Hours Spent Online for Sixteen to Eighteen-Year-Olds. The spread of the data is different in both plots.

Answers: 1


Another question on Mathematics
Mathematics, 21.06.2019 14:30
The amount of money, in dollars, in an account after t years is given by a = 1000(1.03)^t. the initial deposit into the account was $_^a0 and the interest rate was _a1% per year. only enter numbers in the boxes. do not include any commas or decimal points^t. the initial deposit into the account was $__^a0 and the interest rate is % per year.
Answers: 1
Mathematics, 21.06.2019 18:30
Abus travels 36 miles in 45 minutes. enter the number of miles the bus travels in 60 minutes at this rate.
Answers: 2
You know the right answer?
Questions

Biology, 28.12.2019 17:31


Biology, 28.12.2019 17:31
Mathematics, 28.12.2019 17:31

World Languages, 28.12.2019 17:31
Mathematics, 28.12.2019 17:31

History, 28.12.2019 17:31

Social Studies, 28.12.2019 17:31

Social Studies, 28.12.2019 17:31
Mathematics, 28.12.2019 17:31

Business, 28.12.2019 17:31
English, 28.12.2019 17:31


