
Mathematics, 17.12.2019 23:31 wtwbegay
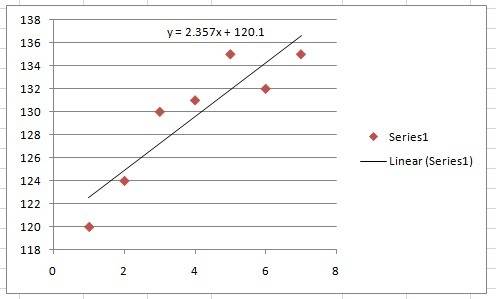
This table contains data on the number of people visiting a historical landmark over a period of one week.. day number of. visitors. 1 120. 2 124. 3 130. 4 131. 5 135. 6 132. 7 135. sketch a scatter plot and draw an estimated regression line. which of these values comes closest to the slope of your regression line? . 0.6. 1.0. 1.6. 2.4. 3.2

Answers: 2


 ,
,


Another question on Mathematics
Mathematics, 21.06.2019 21:00
Hurrya vegetable garden and a surrounding path are shaped like a square that together are 11ft wide. the path is 2ft wide if one bag of gravel covers 9 square feet how many bags are needed to cover the path
Answers: 1
Mathematics, 21.06.2019 22:00
Mrs. avila is buying a wallpaper border to go on all of her kitchen walls. she wants to buy 5 extra feet of wallpaper border than she needs to be sure she has enough. she buys 55.5 feet of the border. the store owner selling the border uses the width of mrs. avila's kitchen to determine that the length of her kitchen must be 14.5 feet.
Answers: 2
You know the right answer?
This table contains data on the number of people visiting a historical landmark over a period of one...
Questions

Health, 16.09.2019 21:50


Mathematics, 16.09.2019 21:50


Social Studies, 16.09.2019 21:50

Mathematics, 16.09.2019 21:50
Social Studies, 16.09.2019 21:50
Mathematics, 16.09.2019 21:50
Mathematics, 16.09.2019 21:50
Social Studies, 16.09.2019 21:50


