
Mathematics, 29.03.2020 20:01 gizmokris
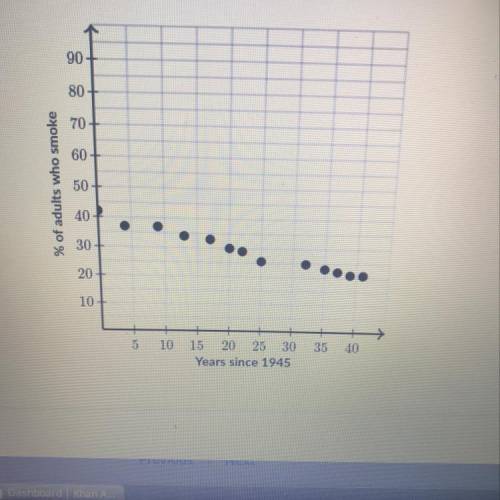
The scatter plot below shows the relationship between the percentage of American adults who smoke and years since 1945.
During this time period, the percentage of adults who smoked changed each year by about
Choose 1 answer
(A) -2 percentage points
(B) -1 percentage points
(C) -1/2 percentage points
(D) -1/4 percentage points

Answers: 3


Another question on Mathematics
Mathematics, 21.06.2019 15:00
Answer this question, only if you know the answer. 30 points and brainliest!
Answers: 1
Mathematics, 21.06.2019 17:30
Daniel bought a computer game for $25 and later sold it to thomas for a 40% profit. how much did daniel sell the computer game for?
Answers: 1
Mathematics, 21.06.2019 19:20
Which number line represents the solution set for the inequality - x 24?
Answers: 3
Mathematics, 21.06.2019 20:00
The art class is planning to paint a mural on an outside wall. this figure is a scale drawing of the wall. width: 11 in length: 28 in unit rate: 1.5 ft per in. write the ratio of the area of the drawing to the area of the actual mural. write your answer as a unit rate. show that this unit rate is equal to the square of the unit rate 1.5 ft per in
Answers: 1
You know the right answer?
The scatter plot below shows the relationship between the percentage of American adults who smoke an...
Questions
Mathematics, 17.11.2020 21:20


Mathematics, 17.11.2020 21:20

Physics, 17.11.2020 21:30
Mathematics, 17.11.2020 21:30
English, 17.11.2020 21:30
English, 17.11.2020 21:30
Mathematics, 17.11.2020 21:30
Mathematics, 17.11.2020 21:30
Mathematics, 17.11.2020 21:30
Mathematics, 17.11.2020 21:30


