
Mathematics, 29.03.2020 20:21 hillmarilyn70pe8sy6
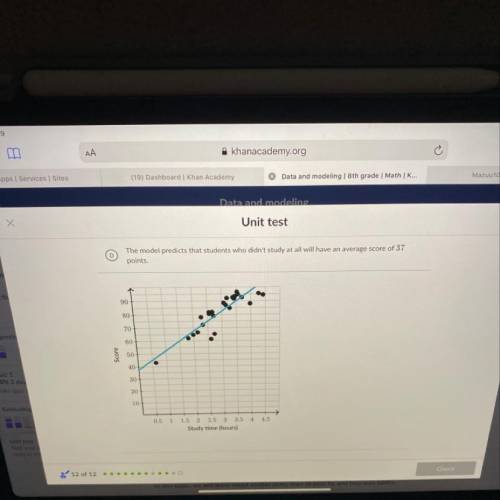
Camille's math test included a survey question asking how many hours students spent studying for the test.
The scatterplot and regression line below show the relationship between how many hours students spent
studying and their score on the test.
The nitted line has a y-intercept of 37
What is the best interpretation of this y-intercept?
A. The model predicts that the study time will increase 37 hours for each additional point scored.
B. The model predicts that the score will increase 37 points for each additional hour of study time.
C. The model predicts that a student who scored 0 points studied for 37 hours.
D. The model predicts that students who didn't study at all will have an average score of 37
points

Answers: 2


Another question on Mathematics
Mathematics, 21.06.2019 15:00
The water has been on the stove y=9.5x+62.1 after how many minutes will the tempature be 138.1 f
Answers: 1
Mathematics, 21.06.2019 16:00
You paint a 1/2 of a wall in 1/4 hour. how long will it take you to paint one wall
Answers: 2
Mathematics, 21.06.2019 20:30
Steve had 48 chocolates but he decided to give 8 chocolats to each of his f coworkers. how many chocolates does steve have left
Answers: 1
Mathematics, 21.06.2019 21:00
Kira looked through online census information to determine the overage number of people living in the homes in her city what is true about kira's data collection?
Answers: 1
You know the right answer?
Camille's math test included a survey question asking how many hours students spent studying for the...
Questions
Mathematics, 20.10.2019 01:30
Mathematics, 20.10.2019 01:30
Mathematics, 20.10.2019 01:30

History, 20.10.2019 01:30


English, 20.10.2019 01:30

Mathematics, 20.10.2019 01:30

Mathematics, 20.10.2019 01:30


