
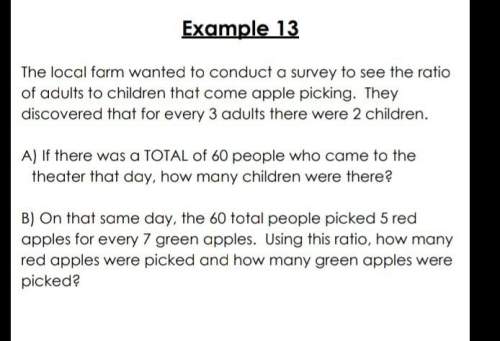
Mathematics, 30.03.2020 17:00 nengliangli523
Household Income All Houses on Church Street (thousands) Mean: 55 Median: 49 Range: 280 Mean Deviation: 19.2 Group 1 38 45 76 93 50 54 29 44 62 31 Group 2 23 74 50 49 67 34 105 59 40 48 Group 3 280 40 39 40 45 52 31 44 50 49 Group 4 27 54 42 40 115 48 72 33 28 61 The summary statistics for household incomes of all of the houses on Church Street are shown. Four sample groups were taken from houses on the street. Which sample group has a mean greater than that of the population?

Answers: 3


Another question on Mathematics
Mathematics, 21.06.2019 21:00
Rewrite the following quadratic functions in intercept or factored form. show your work. y = 5x^2 + 10x
Answers: 1
Mathematics, 21.06.2019 21:30
Using the information in the customer order, determine the length and width of the garden. enter the dimensions. length: feet width: feet
Answers: 3
Mathematics, 21.06.2019 23:30
Consider the sequence below. 3 , 1 , 1/3 , 1/9 , select the explicit function which defines the sequence.
Answers: 1
Mathematics, 22.06.2019 01:30
Determine if the solution set for the system of equations shown is the empty set, contains one point or is infinite. x + y = 5 x + y = 7 {} 1 solution infinite
Answers: 1
You know the right answer?
Household Income All Houses on Church Street (thousands) Mean: 55 Median: 49 Range: 280 Mean Deviati...
Questions

Chemistry, 16.05.2021 01:10

Mathematics, 16.05.2021 01:10

Biology, 16.05.2021 01:10
Mathematics, 16.05.2021 01:10
Mathematics, 16.05.2021 01:10

History, 16.05.2021 01:10

Social Studies, 16.05.2021 01:10

Arts, 16.05.2021 01:10
Mathematics, 16.05.2021 01:10
Mathematics, 16.05.2021 01:10
Mathematics, 16.05.2021 01:10
English, 16.05.2021 01:10


