SUV Sales
SUVS The scatter plot shows the numbers of sport
utility vehicles sold in a city...

Mathematics, 30.03.2020 20:44 jesusmojica25
SUV Sales
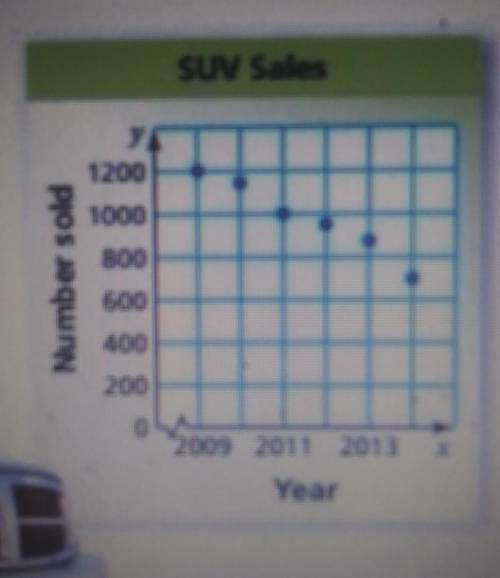
SUVS The scatter plot shows the numbers of sport
utility vehicles sold in a city from 2009 to 2014.
a. In what year were 1000 SUVs sold?
b. About how many SUVs were sold in 2013?
c. Describe the relationship shown by the data.
Number sold
09
2009 2011 2013
Year
X
our answer

Answers: 1


Another question on Mathematics
Mathematics, 21.06.2019 14:30
Apple pie is removed from 350 degree oven. temperature of the pie t minutes after being removed id given by the function t(t)=72+268e-0.068t
Answers: 1
Mathematics, 21.06.2019 16:10
In a sample of 200 residents of georgetown county, 120 reported they believed the county real estate taxes were too high. develop a 95 percent confidence interval for the proportion of residents who believe the tax rate is too high. (round your answers to 3 decimal places.) confidence interval for the proportion of residents is up to . would it be reasonable to conclude that the majority of the taxpayers feel that the taxes are too high?
Answers: 3
Mathematics, 21.06.2019 21:00
Estimate the area under the curve f(x) = 16 - x^2 from x = 0 to x = 3 by using three inscribed (under the curve) rectangles. answer to the nearest integer.
Answers: 1
Mathematics, 21.06.2019 22:30
5. (04.07)which of the following exponential functions goes through the points (1, 12) and (2, 36)? (2 points)f(x) = 3(4)^xf(x) = 4(3)^-xf(x) = 3(4)^-xf(x) = 4(3)^x
Answers: 1
You know the right answer?
Questions
Mathematics, 15.04.2021 15:00

English, 15.04.2021 15:00


Biology, 15.04.2021 15:00


History, 15.04.2021 15:10

Computers and Technology, 15.04.2021 15:10
Mathematics, 15.04.2021 15:10
Biology, 15.04.2021 15:10
Mathematics, 15.04.2021 15:10
Mathematics, 15.04.2021 15:10


