
Mathematics, 01.04.2020 21:46 destinyarisa
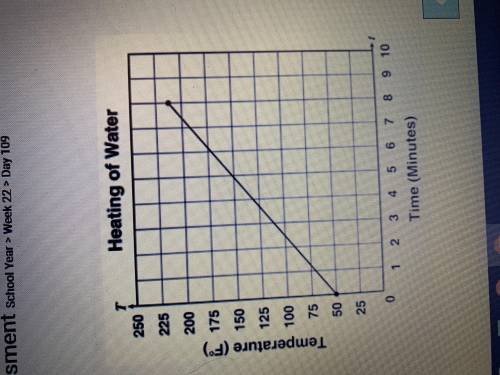
The graph below shows the temperature of water as a function of time as it is heated to its boiling point (212 fahrenheit). what is the range of this function
1) all real numbers less than or equal to 212
2) all real numbers greater than or equal to 50
3) all real numbers between and including zero and eight
4)All real numbers between including 50 and 212

Answers: 1


Another question on Mathematics
Mathematics, 21.06.2019 14:00
The graph of a line gets what as the value of the slope gets bigger
Answers: 2
Mathematics, 21.06.2019 17:30
Which of the following tables represents exponential functions?
Answers: 1
Mathematics, 21.06.2019 19:00
2pointswhich of the following appear in the diagram below? check all that apply.d a. zcdeов. сеo c. aéo d. zdce
Answers: 1
You know the right answer?
The graph below shows the temperature of water as a function of time as it is heated to its boiling...
Questions

Mathematics, 31.01.2021 14:00
Mathematics, 31.01.2021 14:00


Chemistry, 31.01.2021 14:00
English, 31.01.2021 14:00
English, 31.01.2021 14:00
Mathematics, 31.01.2021 14:00
Chemistry, 31.01.2021 14:00
Mathematics, 31.01.2021 14:00

Mathematics, 31.01.2021 14:00
Mathematics, 31.01.2021 14:00
Mathematics, 31.01.2021 14:00
Arts, 31.01.2021 14:00


