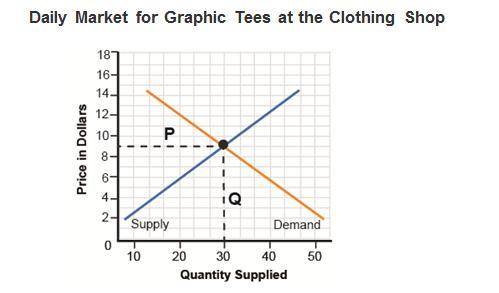
The graph shows a point of equilibrium.
A graph has Quantity supplied on the x-axis and...

Mathematics, 02.04.2020 22:36 tonya3498
The graph shows a point of equilibrium.
A graph has Quantity supplied on the x-axis and price in dollars on the y-axis. A line that represents supply has a positive slope and a line that represents demand has a negative slope. The lines intersect at point (30, 9). Line P is drawn from the point of equilibrium to the y-axis, and line Q is drawn from the point of equilibrium to the x-axis.
What does "P" represent on the graph?
the point where equilibrium is achieved
the price at the equilibrium point
the average price of goods sold
the point where supply and demand drop


Answers: 1


Another question on Mathematics

Mathematics, 21.06.2019 15:00
Can someone answer it, and plot it, for 20 points and brainliest answer? p.s. they're the same ! : )
Answers: 1

Mathematics, 21.06.2019 17:30
Add the fractions, and simply the result to lowest terms. 2/3 + 2/7= ?
Answers: 2

Mathematics, 21.06.2019 18:10
Jordan has $5.37, which he is using to buy ingredients to make salsa. he is buying one red pepper for $1.29 and three pounds of tomatoes. if jordan has exactly the right amount of money he needs, what is the price per pound of the tomatoes? choose the correct equation to represent this real-world problem. solve the equation and verify the reasonableness of your answer. a pound of tomatoes costs .
Answers: 1

Mathematics, 21.06.2019 18:50
The number of fish in a lake can be modeled by the exponential regression equation y=14.08 x 2.08^x where x represents the year
Answers: 3
You know the right answer?
Questions


Social Studies, 30.03.2021 01:50


Mathematics, 30.03.2021 01:50


History, 30.03.2021 01:50


Mathematics, 30.03.2021 01:50

Mathematics, 30.03.2021 01:50

Mathematics, 30.03.2021 01:50

History, 30.03.2021 01:50


Mathematics, 30.03.2021 01:50


