
Mathematics, 03.04.2020 01:25 elloemill
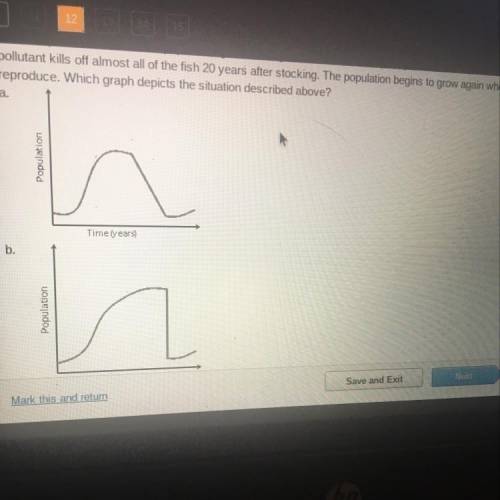
The population of fish in a pond in relation to the number of years since stocking is depicted on a graph. For the first few years
after the pond is stocked, the population grows slowly. It increases more quickly as the fish reproduce, then it levels off. A
pollutant kills off almost all of the fish 20 years after stocking. The population begins to grow again when the remaining fish
reproduce. Which graph depicts the situation described above?
Population
Time vears
Population
Mark this and retum
Submit
Save and Exit
Yep

Answers: 3


Another question on Mathematics
Mathematics, 21.06.2019 17:20
Asap describe the transformations required to obtain the graph of the function f(x) from the graph of the function g(x). f(x)=-5.8sin x. g(x)=sin x. a: vertical stretch by a factor of 5.8, reflection across y-axis. b: vertical stretch by a factor of 5.8,reflection across x-axis. c: horizontal stretch by a factor of 5.8, reflection across x-axis. d: horizontal stretch by a factor of 5.8 reflection across y-axis.
Answers: 1
Mathematics, 22.06.2019 00:00
To convert celsius temperatures to fahrenheit, you can use the expression (c + 32). tom says that another way to write this expression is c + 32. what error did tom make?
Answers: 3
Mathematics, 22.06.2019 01:00
The computer that controls a bank's automatic teller machine crashes a mean of 0.6 times per day. what is the probability that, in any seven-day week, the computer will crash less than 5 times? round your answer to four decimal places
Answers: 2
Mathematics, 22.06.2019 02:20
Stu and ambrose are working together on a study of whether diet is related to students' mental health. first, they randomly select 10 students from the student center and 10 students from the office of counseling and psychological services. then, they ask students to rate their diet in terms of healthiness on a scale of 1-100 before completing a 20-item mental health survey. a) name one of the constructs being studied b) how was the construct you named above operationally defined in this experiment? e) was the variable you described above their independent variable, their dependent variable, or a controlled variable? d) what is a confounding variable? what is a potential confound in this study?
Answers: 3
You know the right answer?
The population of fish in a pond in relation to the number of years since stocking is depicted on a...
Questions


Chemistry, 10.05.2021 20:50


English, 10.05.2021 20:50

Mathematics, 10.05.2021 20:50
Mathematics, 10.05.2021 20:50
Mathematics, 10.05.2021 20:50

Business, 10.05.2021 20:50


