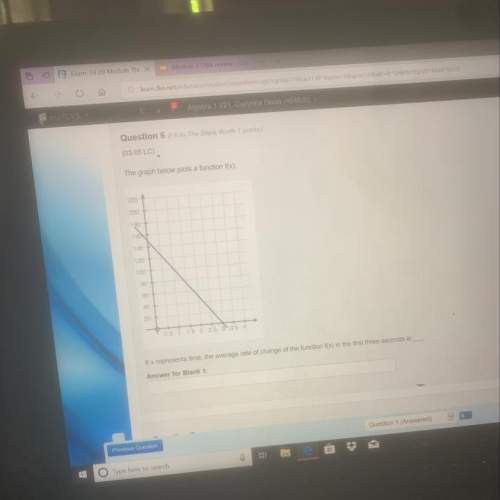
The graph shows a linear relationship between the
height and years of a plant's growth. Find t...

Mathematics, 04.04.2020 05:00 barbie1salome
The graph shows a linear relationship between the
height and years of a plant's growth. Find the rate of
change. Select all that apply.
The rate of change of a linear function is always the
same.
Height (in)
The rate of change of a linear function increases as
the input increases.
The rate of change from 2 years to 4 years on the
graph is 1.5 inches per year.
L! The rate of change from 0 years to 6 years on the
graph is 1.5 inches per year.
8
Time (yrs)

Answers: 2


Another question on Mathematics
Mathematics, 21.06.2019 14:40
Given the statements, "a square root of 16 is 4," and "a square root of 9 is -3," complete the following blanks with the correct truth-values. p is and q is , so the statement, "a square root of 16 is 4 or a square root of 9 is -3" is .
Answers: 3
Mathematics, 21.06.2019 15:40
Given the following sampling distribution of one mean with a sample size 49, from a normally distributed population,find the population standard deviation, o.79828588912497
Answers: 3
Mathematics, 21.06.2019 19:00
1) in triangle the, what is the measure of angle t (in degrees)? 2) in triangle bat, the measure of angle b is 66∘, and the measure of angle t is 77∘.what is the measure of the exterior angle at a (in degrees)?
Answers: 1
Mathematics, 21.06.2019 20:30
Steve had 48 chocolates but he decided to give 8 chocolats to each of his f coworkers. how many chocolates does steve have left
Answers: 1
You know the right answer?
Questions
Mathematics, 20.08.2019 03:50


History, 20.08.2019 03:50
History, 20.08.2019 03:50
Mathematics, 20.08.2019 03:50

Physics, 20.08.2019 03:50

Biology, 20.08.2019 03:50
History, 20.08.2019 03:50
Mathematics, 20.08.2019 03:50


