
Mathematics, 05.04.2020 21:57 knowingwhat
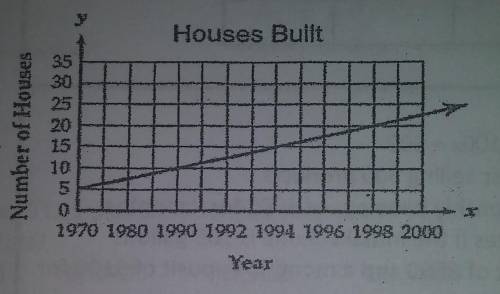
The graph shows the number of new houses built from 1970 to 2000. The mayor used the graph to claim the number built increased at a constant rate.
A) It is valid because the graph shows a constant rate of change.
B) It is valid because 30 years is long enough to evaluate the increase.
C) It is not valid because the scale on the vertical axis is inappropriate.
D) It is not valid because the scale on the horizontal axis is inappropriate.

Answers: 1


Another question on Mathematics
Mathematics, 21.06.2019 21:20
An office supply company conducted a survey before marketing a new paper shredder designed for home use. in the survey, 80 % of the people who tried the shredder were satisfied with it. because of this high satisfaction rate, the company decided to market the new shredder. assume that 80 % of all people are satisfied with this shredder. during a certain month, 100 customers bought this shredder. find the probability that of these 100 customers, the number who are satisfied is 69 or fewer.
Answers: 2
Mathematics, 21.06.2019 22:30
For the chance to be team captain, the numbers 1-30 are put in a hat and you get two chances to pick a number, without replacement. which formula correctly shows how to find the probability that you choose the number 1 and then 2?
Answers: 1
Mathematics, 22.06.2019 04:10
Find the tenth term in the following geometric sequence. 8, 4, 2, 1, . .a) 13b) 0.0078c) 0.0156d) 12.5
Answers: 2
You know the right answer?
The graph shows the number of new houses built from 1970 to 2000. The mayor used the graph to claim...
Questions
Mathematics, 05.05.2020 20:35

Advanced Placement (AP), 05.05.2020 20:35

Geography, 05.05.2020 20:35


Physics, 05.05.2020 20:35

English, 05.05.2020 20:35
Mathematics, 05.05.2020 20:35

Chemistry, 05.05.2020 20:35

Mathematics, 05.05.2020 20:35
Mathematics, 05.05.2020 20:35
Mathematics, 05.05.2020 20:35
English, 05.05.2020 20:35


